Configuring Zabbix for monitoring access points and Keenetic routers
In all cases when I came across the use of Keenetic in business, none of the owners set up means of active monitoring of these devices, even if there were two or three dozen access points. There can be many reasons for this, ranging from banal laziness and lack of knowledge to the fact that even in the Keenetic database it is well monitored through its own application or cloud service RMM: it may seem that this is enough for small objects, but this is a fundamentally erroneous position.
What is missing in the built-in Keenetic RMM monitoring tools?
Any proprietary monitoring tool covers only the devices of the manufacturer itself, that is, yes, you can see such mandatory parameters as the availability of new firmware, the online status of routers or even resource utilization, but as soon as you encounter problems in the network infrastructure, you first need detailed statistics on devices, secondly, you need coverage of all network clients, including their metrics and logs. "Who was doing what at the time of the crash? What was the traffic on the ports and what was the workload of the radio at lunch, when the video conference is lagging?". In addition, if you have a large fleet of devices from different companies, you need a single point for monitoring status and events. Simply put, Keenetic RMM lacks something like this:
There are a lot of platforms for monitoring today: this and Nagios, and Netdata, and stack Grafana/Loki/Prometheus, and of course Zabbix, which has become a de facto standard for system administrators and network engineers. All of them are free, fairly stable, can work locally or in the cloud. In this article, we will look at the integration of Keenetic devices into the Zabbix platform. We will assume that this software is already installed in your company (installed in 15 minutes from here), and we just have to add Keenetic to it.
Enabling SNMP on Kinetics
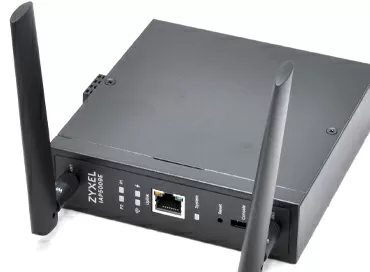
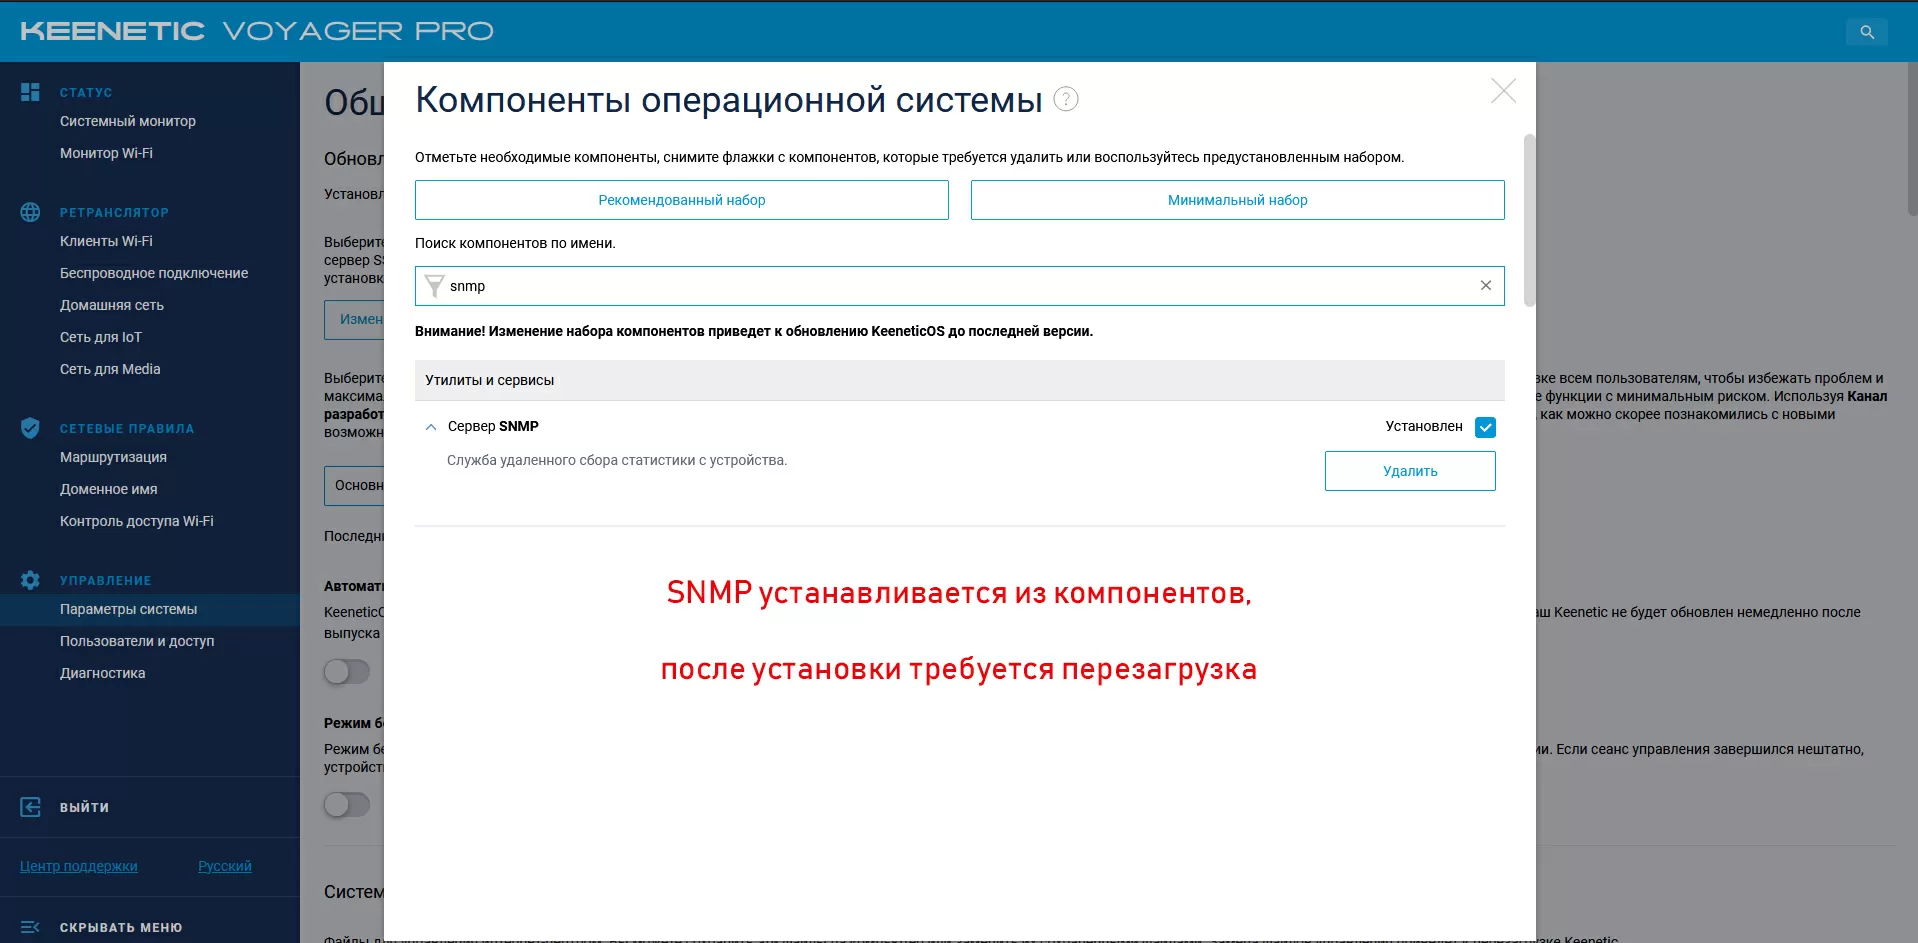
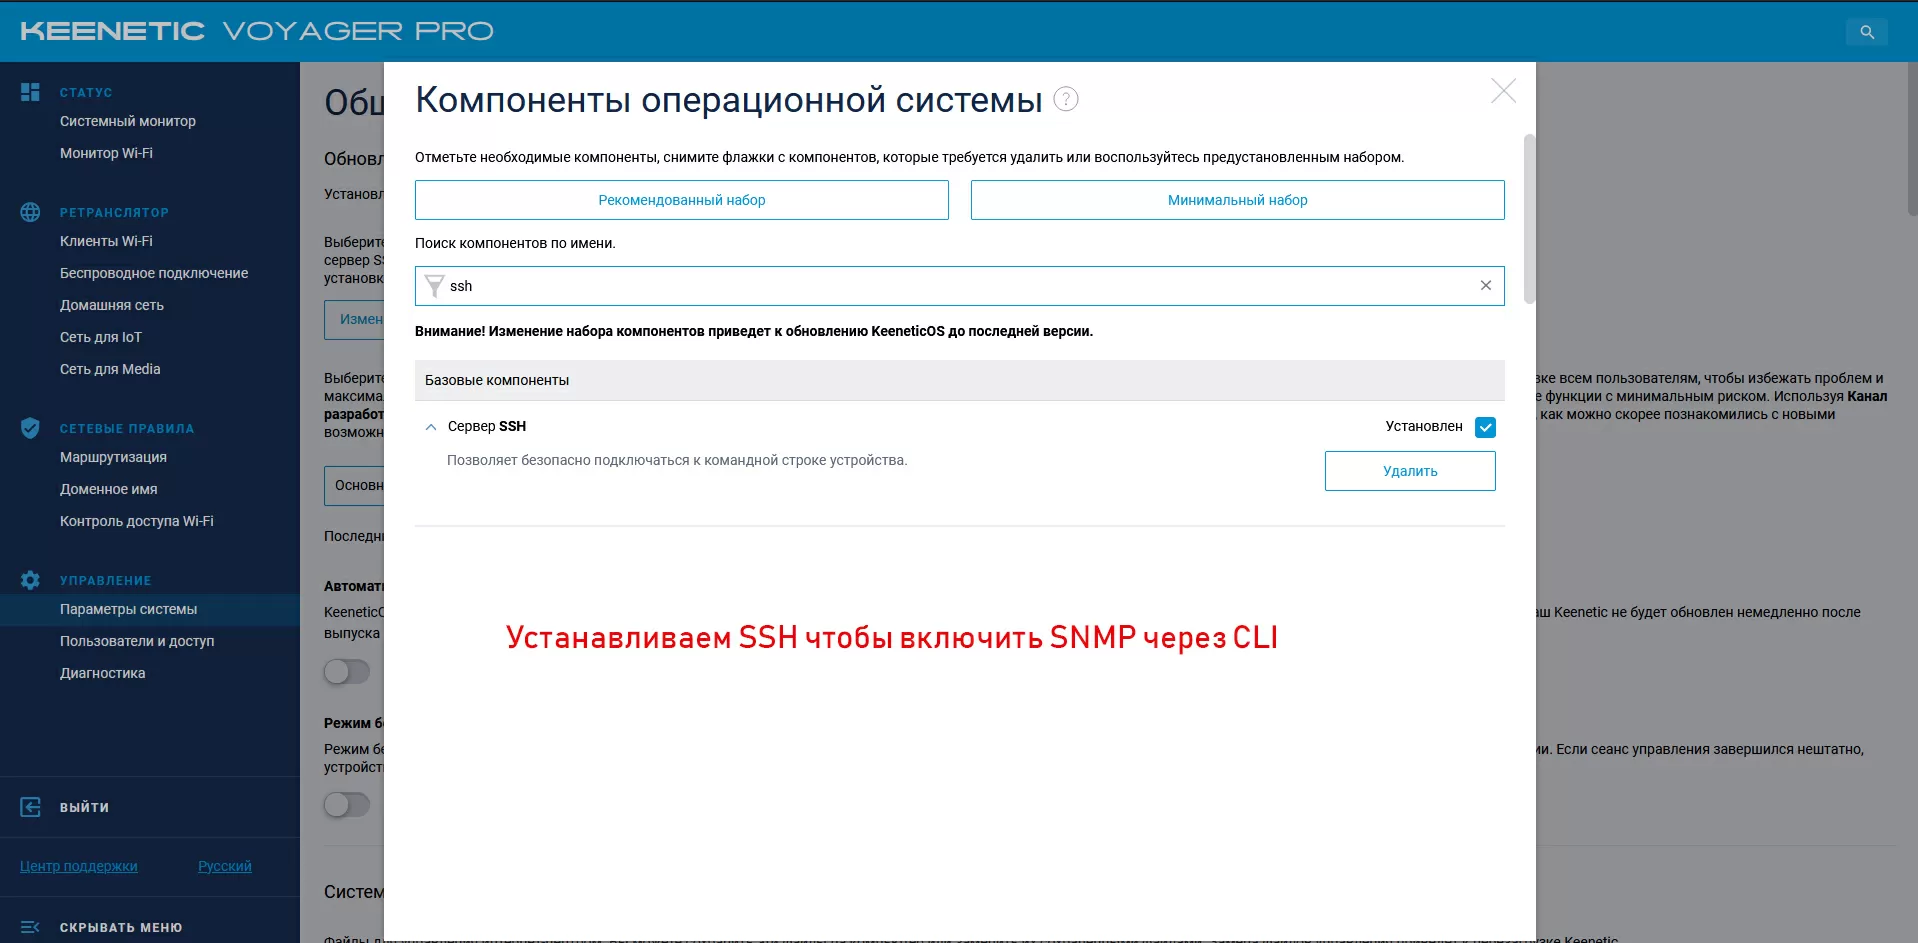
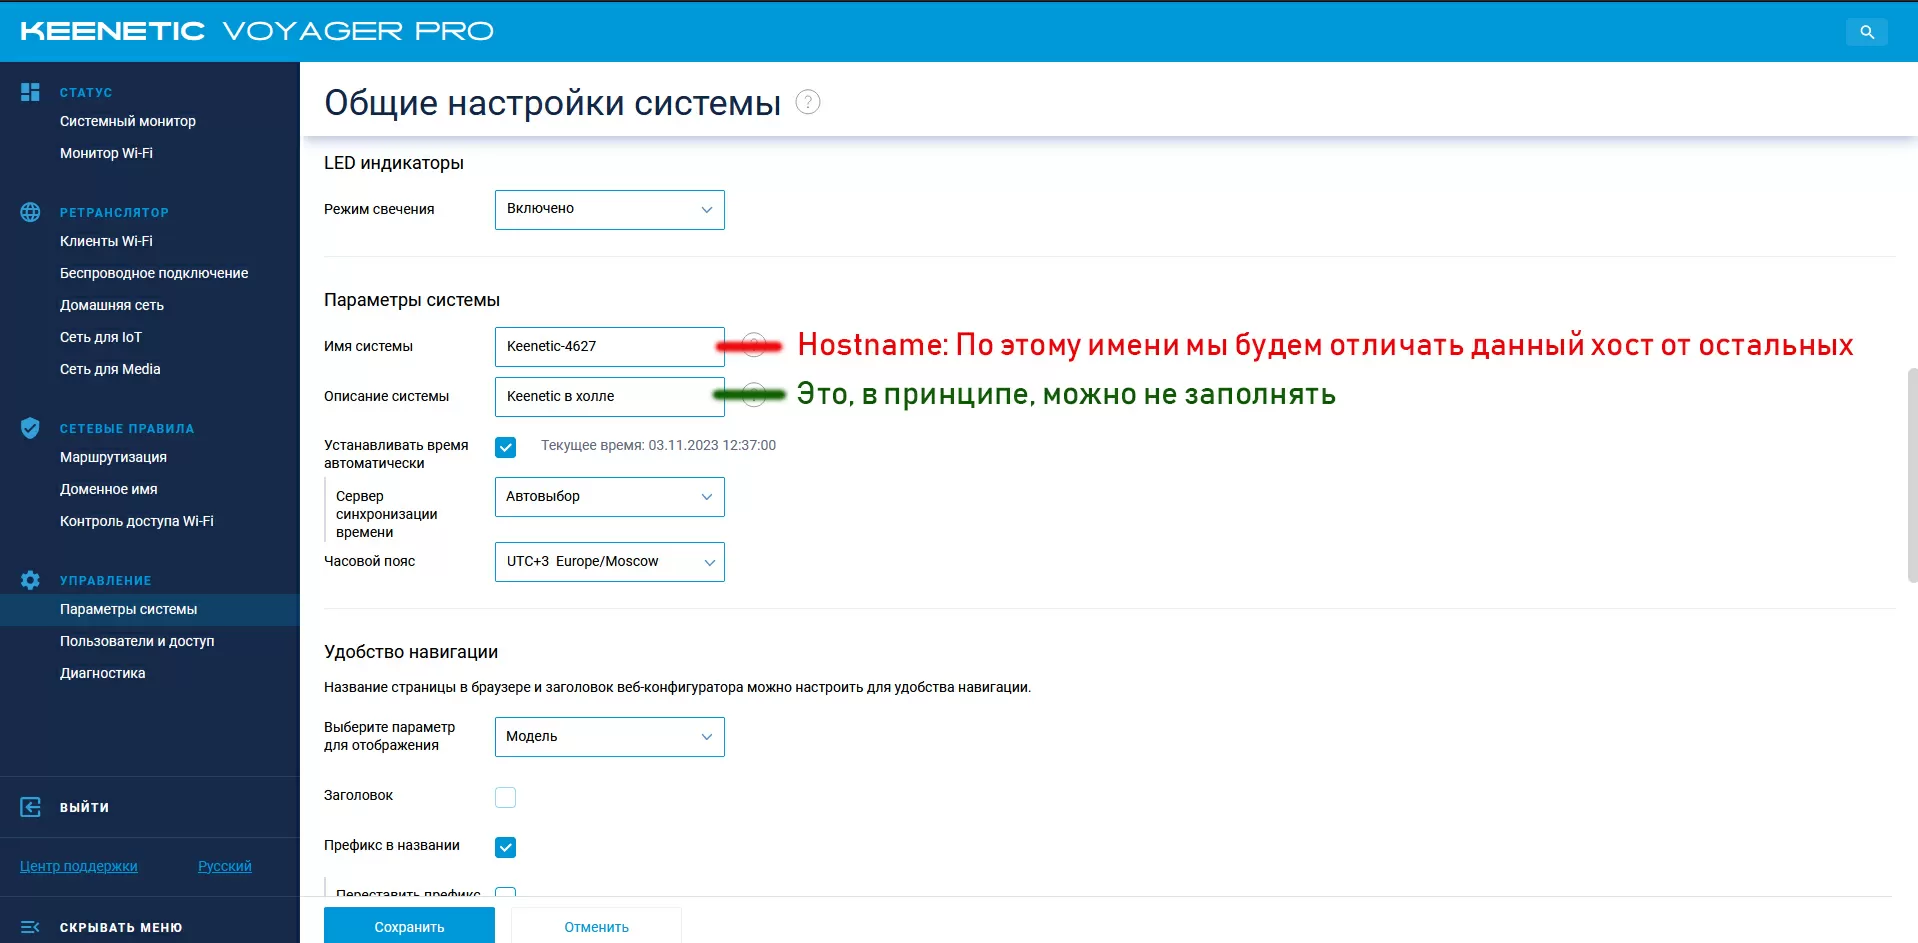
Keenetic supports SNMP v1/2c for exporting system information to third-party services. The "SNMP server" package is installed via the Keenetic Web interface, regardless of which mode the device router or access point is operating in. Immediately do not forget to enable SSH protocol support in order to access the Kinetic from the terminal and enable the SNMP service in accordance with with the instruction. And yes, it would be better to rename the host name to make it easier to distinguish one kinetic from another in the logs, although this is not necessary: Voyager access points already from the factory have a name like Keenetic-XXXX with a unique number, but who knows - suddenly there will be a repeat?
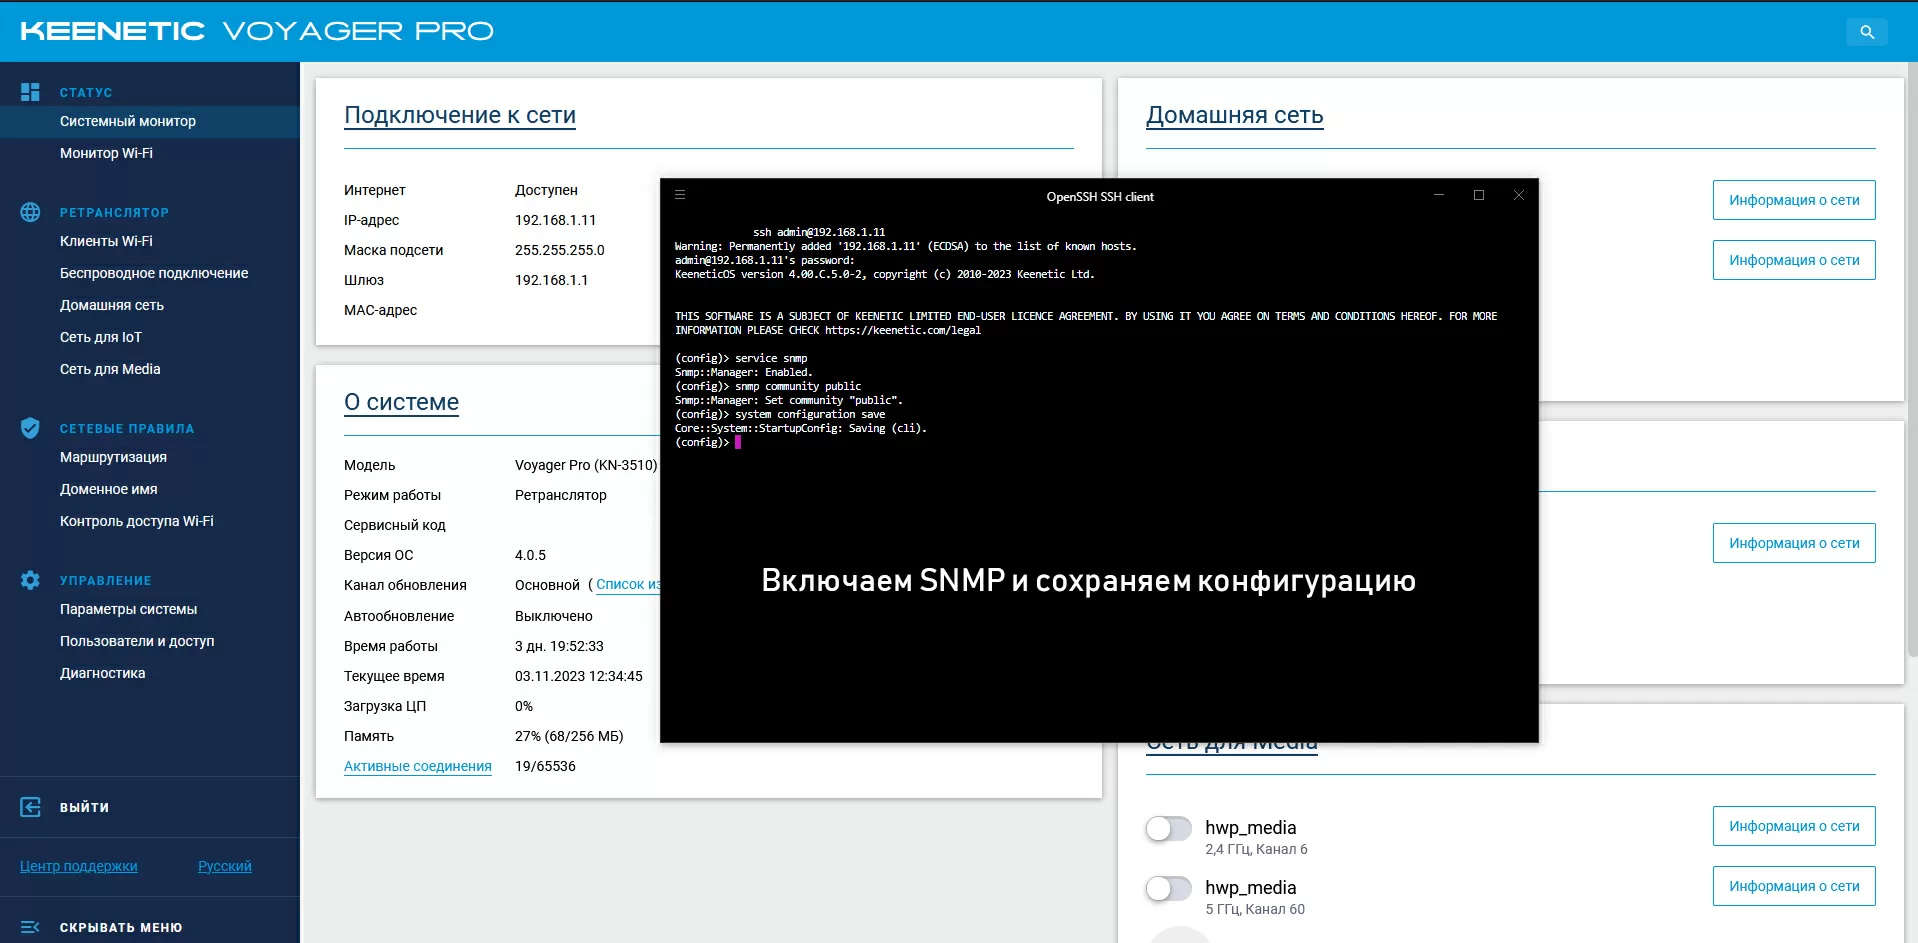
After making sure that the service is running and processing incoming requests, we proceed to parsing the data that can be extracted via SNMP from the Kinetic. The instructions on the link above describe in detail the process of working with MIB files containing a description of the metrics received via SNMP. After studying them, I was a little upset: there are very few metrics themselves, and most of them relate to the Keenetic router part, and for Voyager Pro or Orbiter operating in access point mode, there is not enough information about the Wi–Fi channels used, signal level, motherboard temperature and the number of clients at stations. Of the useful things for me here, in general, there is only data on the CPU load (instant and average for 1, 5, 15 minutes) and the amount of memory. If you are actively using the router as a network drive ( see our article about configuring the NAS on the router) – you will need to export information about the connected media that is here.
Below I give a list of the most important OIDs that you may need to automate tag assignment or inventory (not covered in this article).
|
OID |
What shows |
Example value |
|
.1.3.6.1.2.1.1.5.0 |
Hostname |
Keenetic-4627 |
|
.1.3.6.1.2.1.1.1.0 |
Inf. about the system, including the firmware |
Keenetic Voyager Pro (KeeneticOS 4.00.C.5.0-2): KN-3510 |
|
.1.3.6.1.2.1.47.1.1.1.1.11 |
Device serial number |
S2149WF000005 |
|
.1.3.6.1.2.1.47.1.1.1.1.12 |
Manufacturer |
Keenetic |
|
.1.3.6.1.2.1.47.1.1.1.1.13 |
P/N devices |
KN-3510 |
And the following table shows the most important OIDs for health monitoring and metrics collection tools.
|
OID |
What shows |
Example |
|
.1.3.6.1.4.1.2021.10.1.5.1 |
Mean CPU load in % in 1 minute |
9 |
|
.1.3.6.1.4.1.2021.10.1.5.2 |
Average CPU usage in % in 5 minutes |
16 |
|
.1.3.6.1.4.1.2021.10.1.5.3 |
Average CPU usage in % in 15 minutes |
11 |
|
.1.3.6.1.4.1.2021.4.5.0 |
Total amount of RAM, KB |
254960 |
|
.1.3.6.1.4.1.2021.4.6.0 |
Available amount of RAM excluding caches and buffers, KB |
147008 |
|
.1.3.6.1.4.1.2021.10.1.3.1 |
Load Average 1 minute |
0.09 |
|
.1.3.6.1.4.1.2021.10.1.3.2 |
Load Average 5 minutes |
0.16 |
|
.1.3.6.1.4.1.2021.10.1.3.3 |
Load Average 15 minutes |
0.11 |
If you use Keenetic as a NAS:
|
OID |
What shows |
Example values |
|
.1.3.6.1.4.1.2021.9.1.6.1 |
External disk size in KB |
9767307529 |
|
.1.3.6.1.4.1.2021.9.1.7.1 |
The amount of free space on the external disk in KB |
348946688 |
|
.1.3.6.1.4.1.2021.9.1.9.1 |
How much% is occupied on the external disk |
65 |
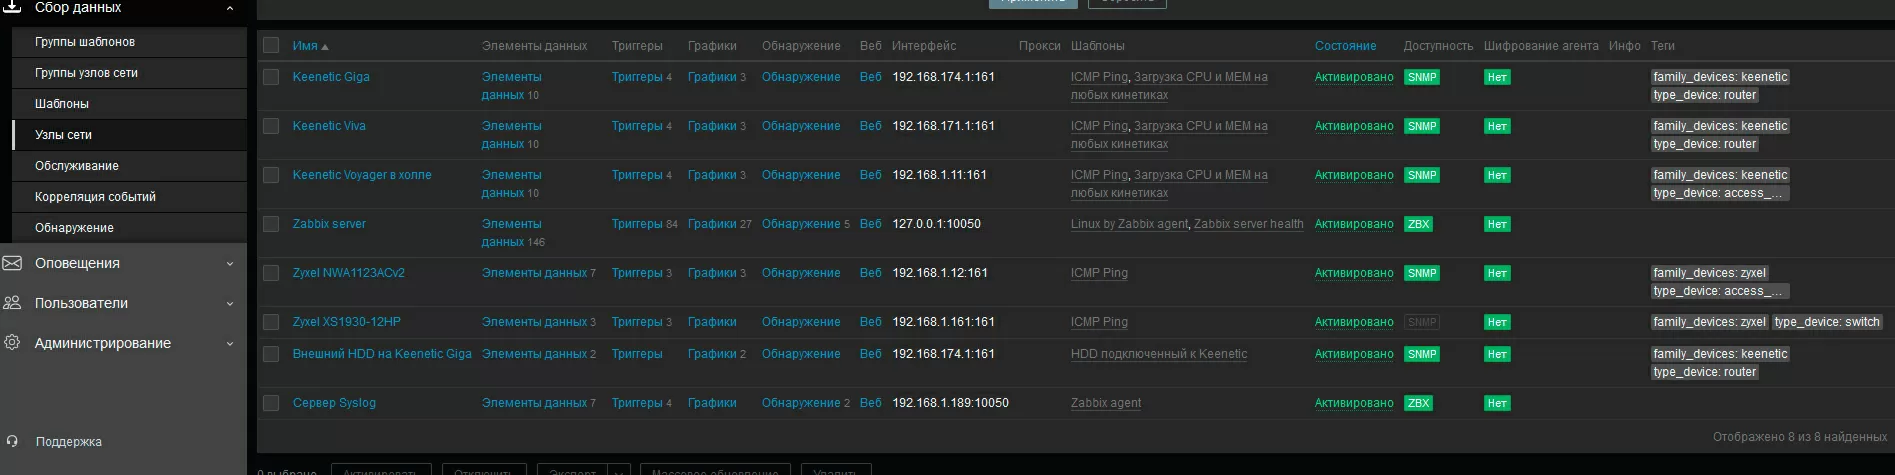
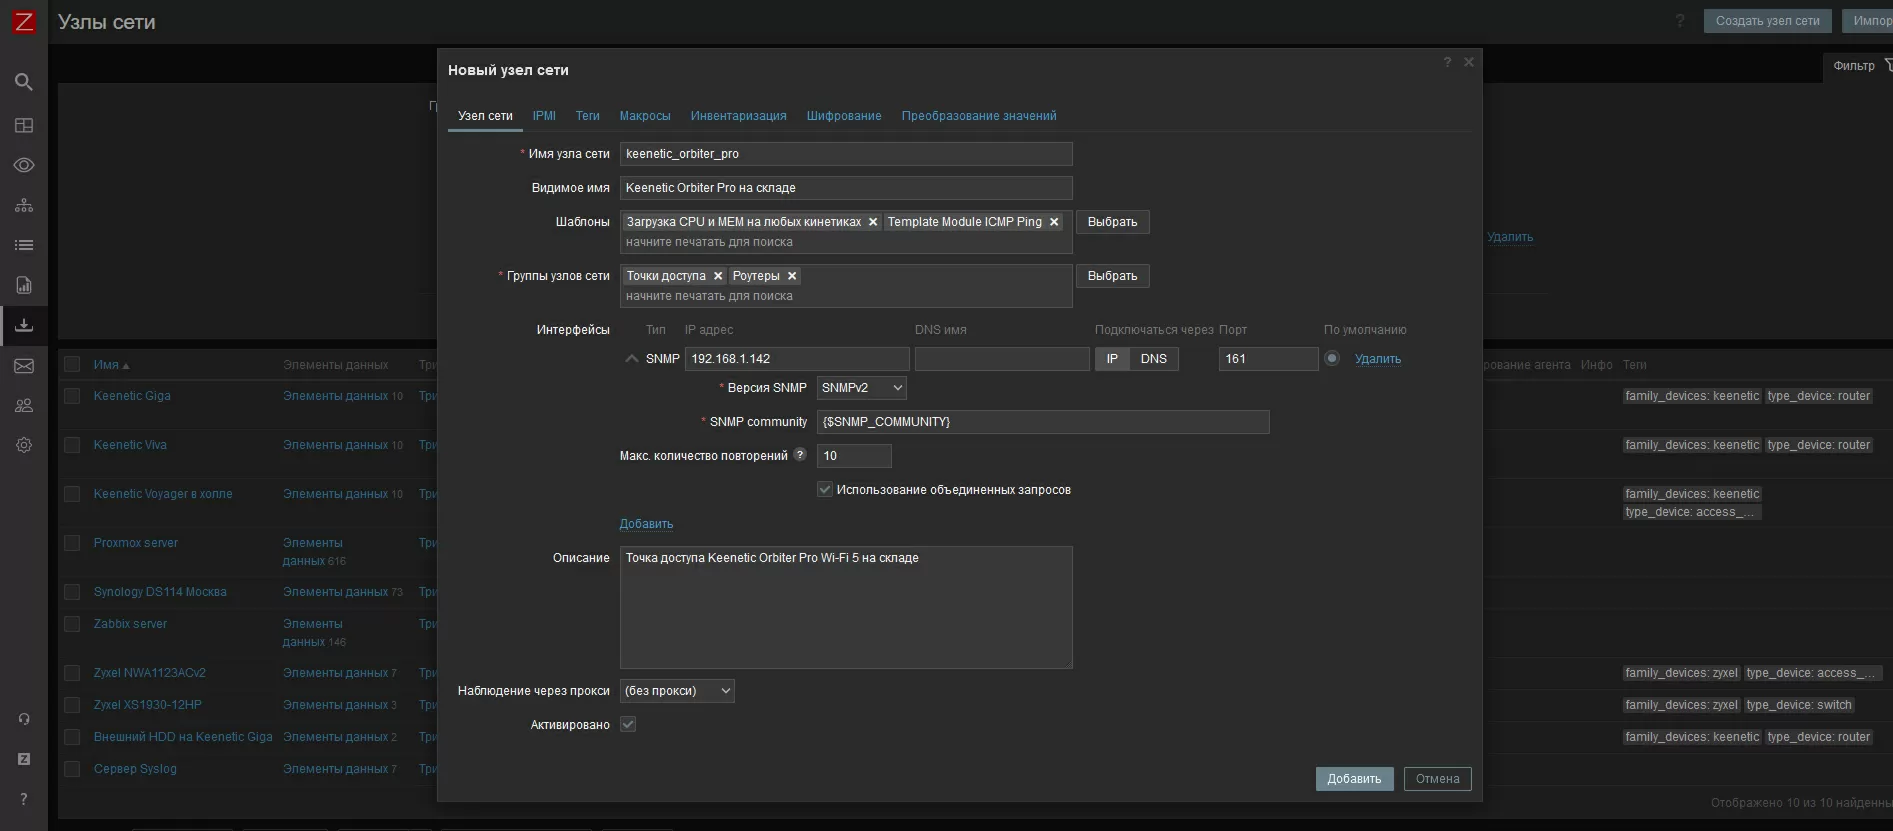
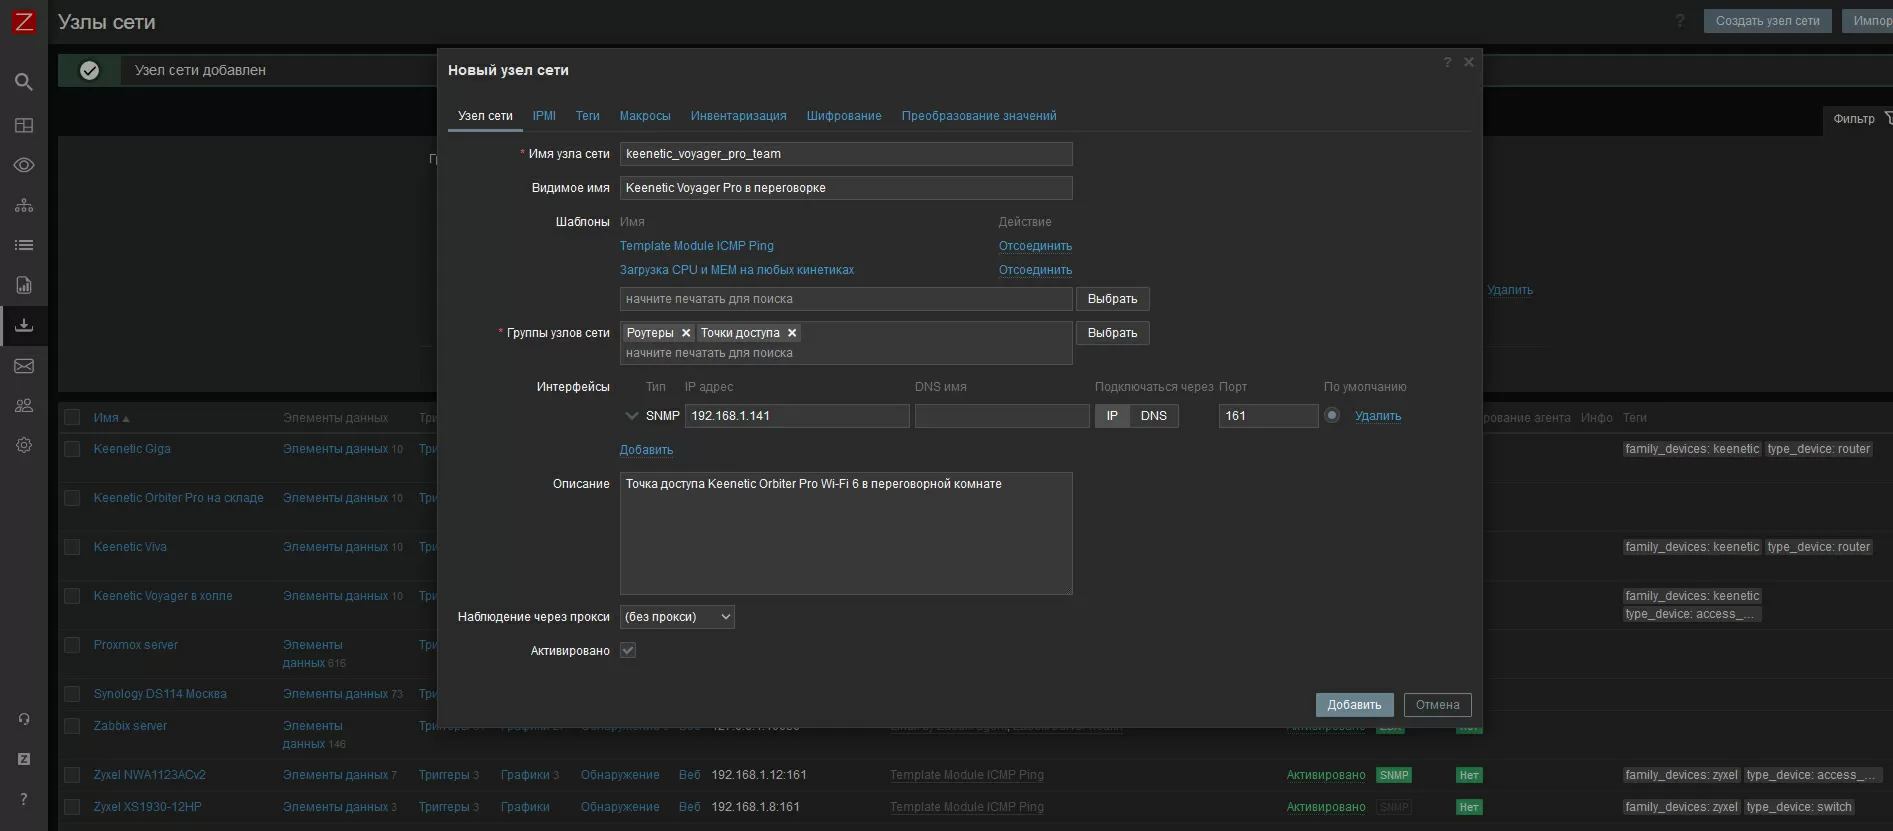
It doesn't matter if you have one, two or many kinetics in your company, we always start with one. In the logical representation of Zabbix, the same node can be monitored in different ways at the same time, so we first need to add our Keenetic, and then apply different options for collecting metrics to it (so-called Data Elements, or IDs).
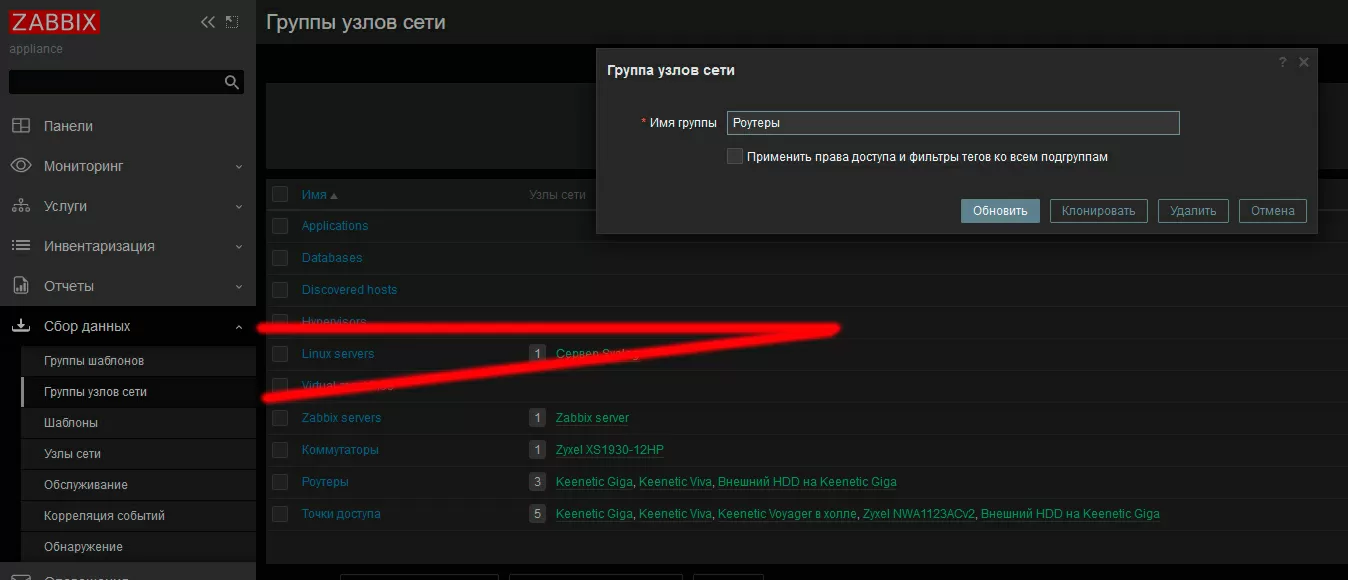
It always makes sense to create a separate group of nodes, for example, "access points" or "routers" or "kinetics" – this can be done at any time, both before and after setup.
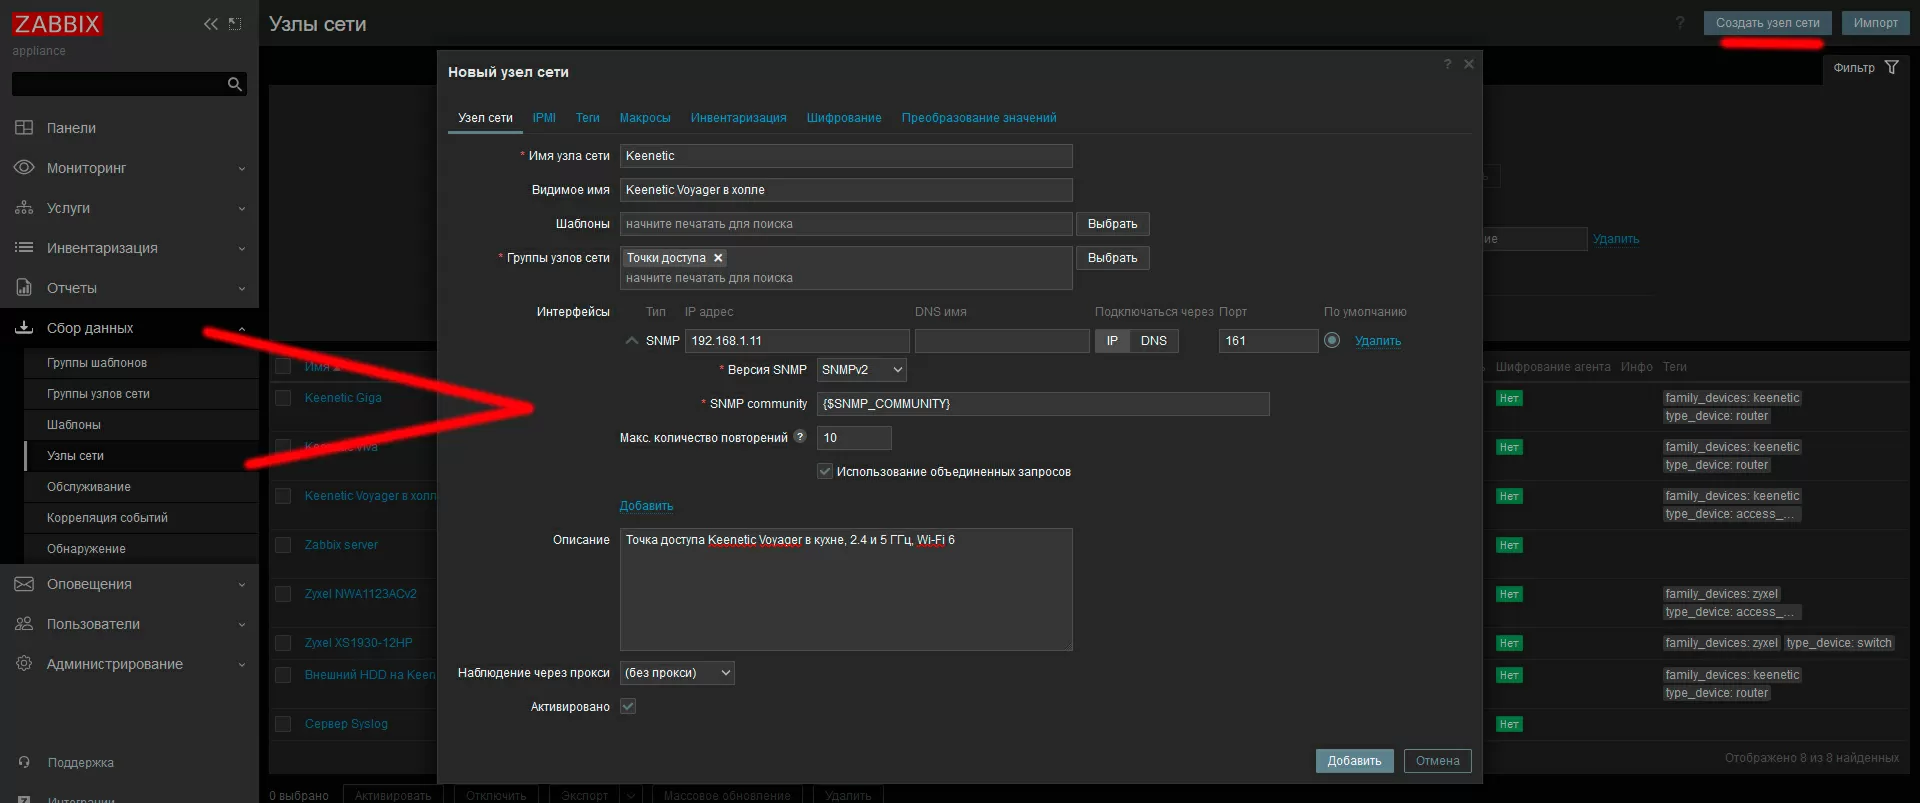
When creating a node, we specify its IP address or network name, and in the community field it is better to hard-write the name of SNMP, even if you have the default value - public. Prior to version 6.4 in Zabbix, it was convenient to import templates obtained from MIB files using the script mib2zabbix, but as it often happens, the template format was changed, and the script was not rewritten, so in version 6.4 OIDs will have to enter manually.
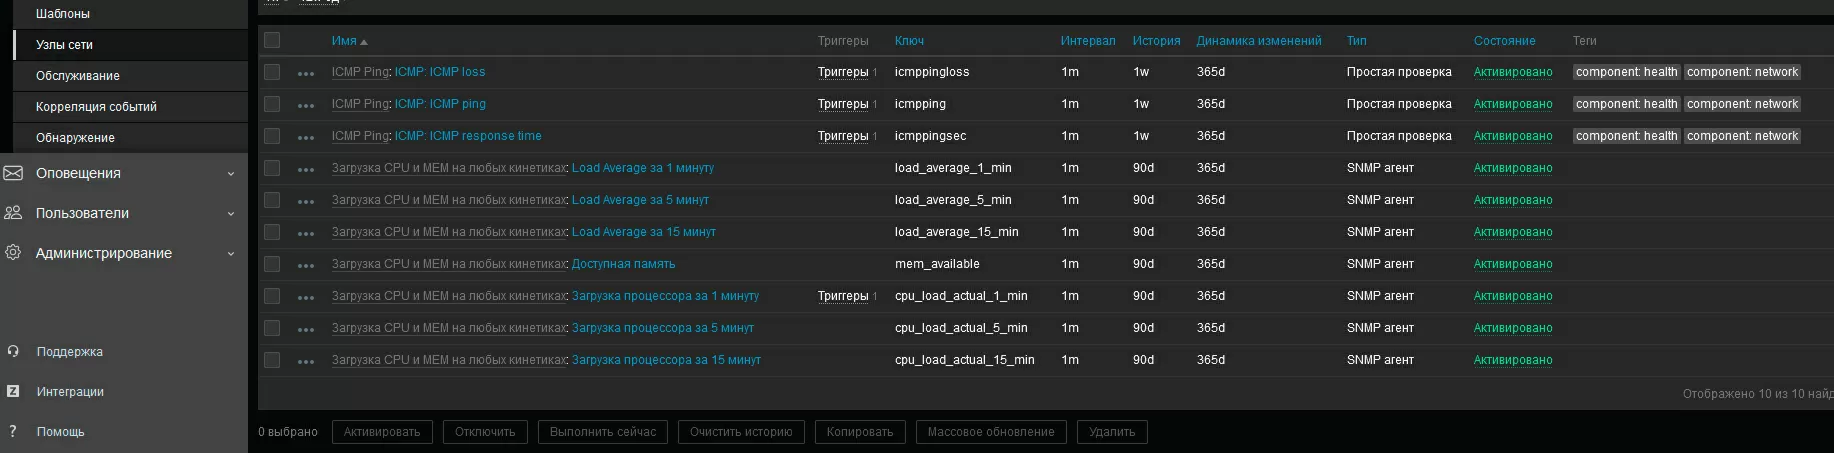
So, after adding the first Keenetic, click on the link "Data Elements", and then in the upper right corner "Add element". Please note - at this point, the SNMP icon should already be green next to the node name. If not, we find out why the SNMP service is not working for you (we check the installation of net-snmp on the server, firewall rules if the device is on another network, etc.).
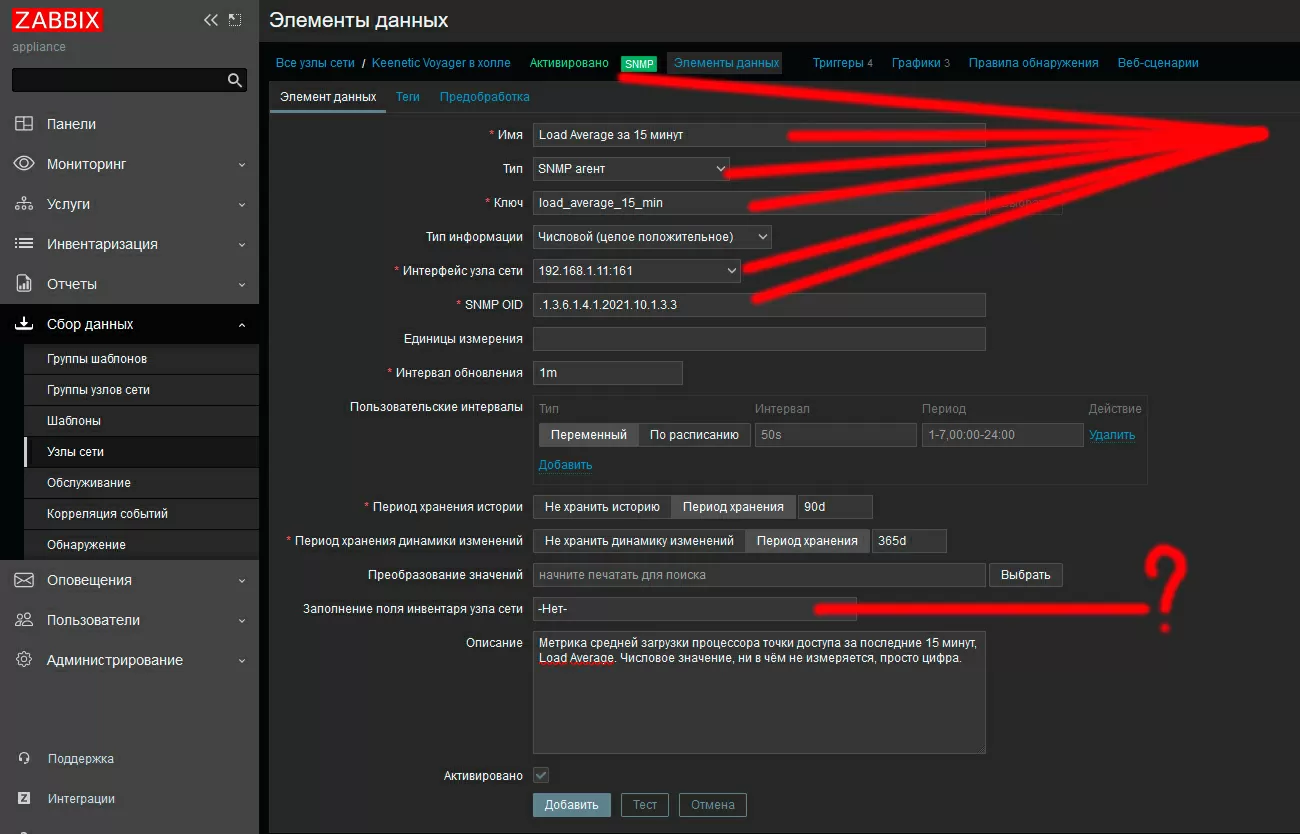
Select the type "SNMP agent", and now we have to enter the name of the metric, for example, "Average Load Average for the last 15 minutes", assign it an ID in the "key" field, for example, "load_average_15_min" and enter the OID. Please note in the screenshot above, the question mark indicates an optional field for filling in an inventory item. Zabbix supports automatic filling of node card elements from SNMP data. In addition to serial numbers and P/N, it makes sense to enter the MAC addresses of devices there so that they are always at hand. As you correctly understood, each such element is a separate data element and a separate OID.
After you have configured the import of metrics, it makes sense to create triggers, for example, to receive a notification when the CPU load exceeds 75% for the last 5 data update cycles. With the help of the regular expression constructor, you can set your own alarm conditions depending on the needs of the network.
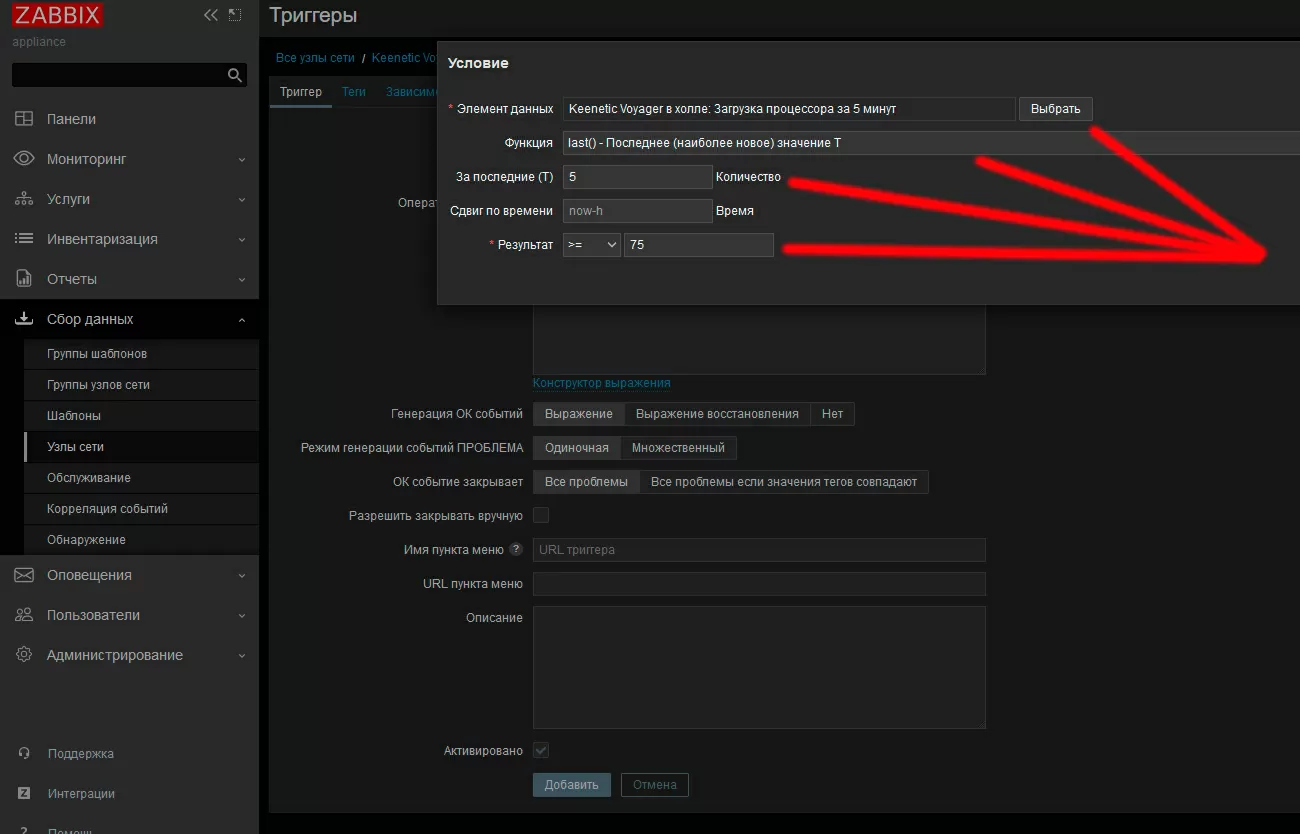
Similarly, we create as many triggers as we need, following the principle: if you created a data element for some reason, then you need a trigger for it, and perhaps not one. As you can see, everything is simple in this part, it will be more difficult later.
Setting up log collection
Zabbix does not have a built-in log server to which logs from devices could be broadcast, so we need to raise a separate Syslog server on the network (here instructions for installing on Ubuntu), register its address on all kinetics and put Zabbix Agent on this server in active mode to broadcast the collected logs already to the monitoring platform itself. From my own experience, I recommend putting rsyslog on a separate virtual machine, because so that if you make a mistake with logrotate, you don't have all the space on the server clogged up. In our example, the Syslog server has the address 192.168.1.189, and we register it in Keenetic.
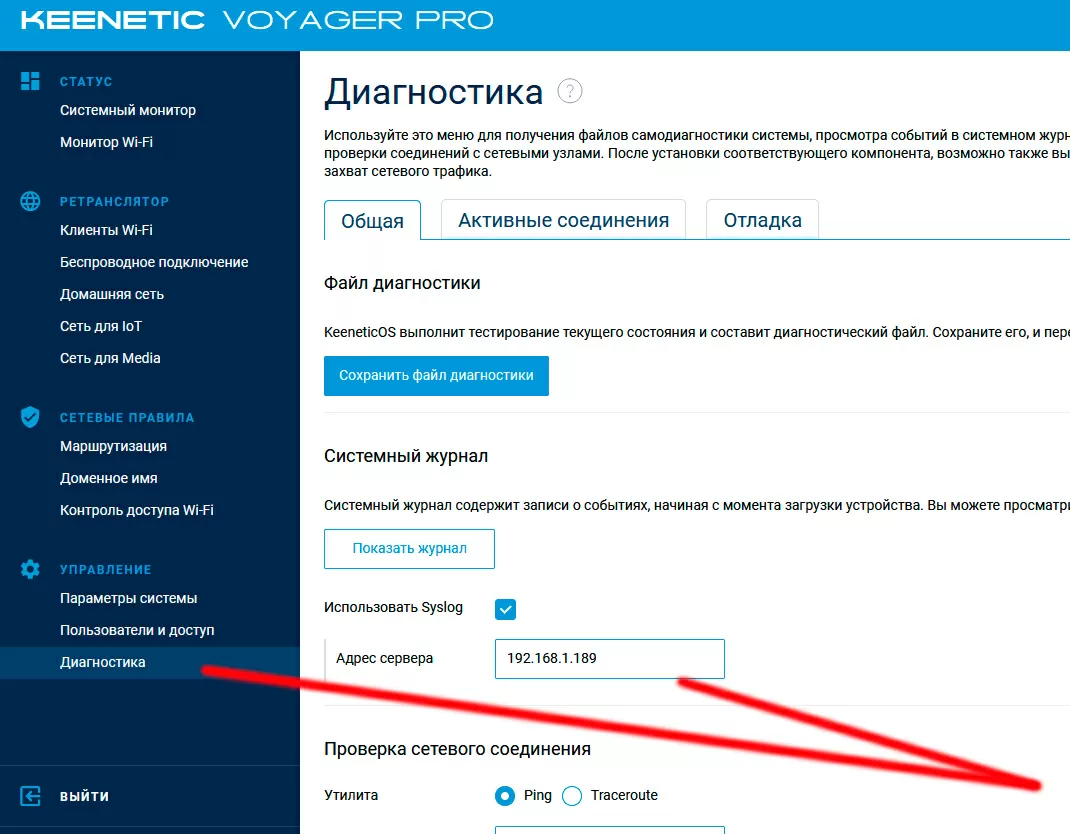
Keenetic devices support exporting logs to the Syslog server without authorization and only via the UDP protocol, so if your main Syslog server is configured differently, you can simply raise a separate instance of the log server for Keenetic.
The Zabbix agent is installed under your OS on which rsyslog is running, according to the instructions with official site, I also recommend reading here is this manual. Please note – after installation, the agent must be configured by adding the Zabbix server address to the config. In my example Zabbix server has an IP address of 192.168.1.183, and I have added the following lines to /etc/zabbix/zabbix_agentd.conf:
Server=192.168.1.183 ListenPort=10050 ListenIP=0.0.0.0 ServerActive=192.168.1.183 Hostname=syslog-server
In order to distinguish between "kinetics" in the general flow of journal information, it makes sense to allocate a separate log saving template for them on the Syslog server by adding this content to /etc/rsyslog.conf:
$template KEENETIC, "/var/log/keenetic/keenetic.log" if $hostname contains 'Keenetic' then ?KEENETIC
In this template, we put all the kinetic logs into the /var/log/keenetic directory in a separate file keenetic.log, inside which we will distinguish each access point by its host name.
By default, Keenetic sends all events to the log, such as connecting clients, changing the radio band, and so on. Detailed logs in the era of large and fast SSDs are good, but in order not to clog up space on the Syslog server, we turn on rotation by creating a file /etc/logrotate.d/keenetic.conf and writing the following settings in it:
/var/log/keenetic/*.log { su root syslog weekly olddir /var/log/keenetic/old rotate 7 missingok notifempty create 0777 root root postrotate systemctl restart syslog endscript }
With default settings Zabbix Agent does not have access to the log file – this problem can be solved in different ways, but since I have a Syslog server running in a separate virtual machine, I just set the rights 0777 to /var/log/keenetic/keenetic.log and I run the agent from root. Yes, I know it may not be safe, but you can do it differently at home.
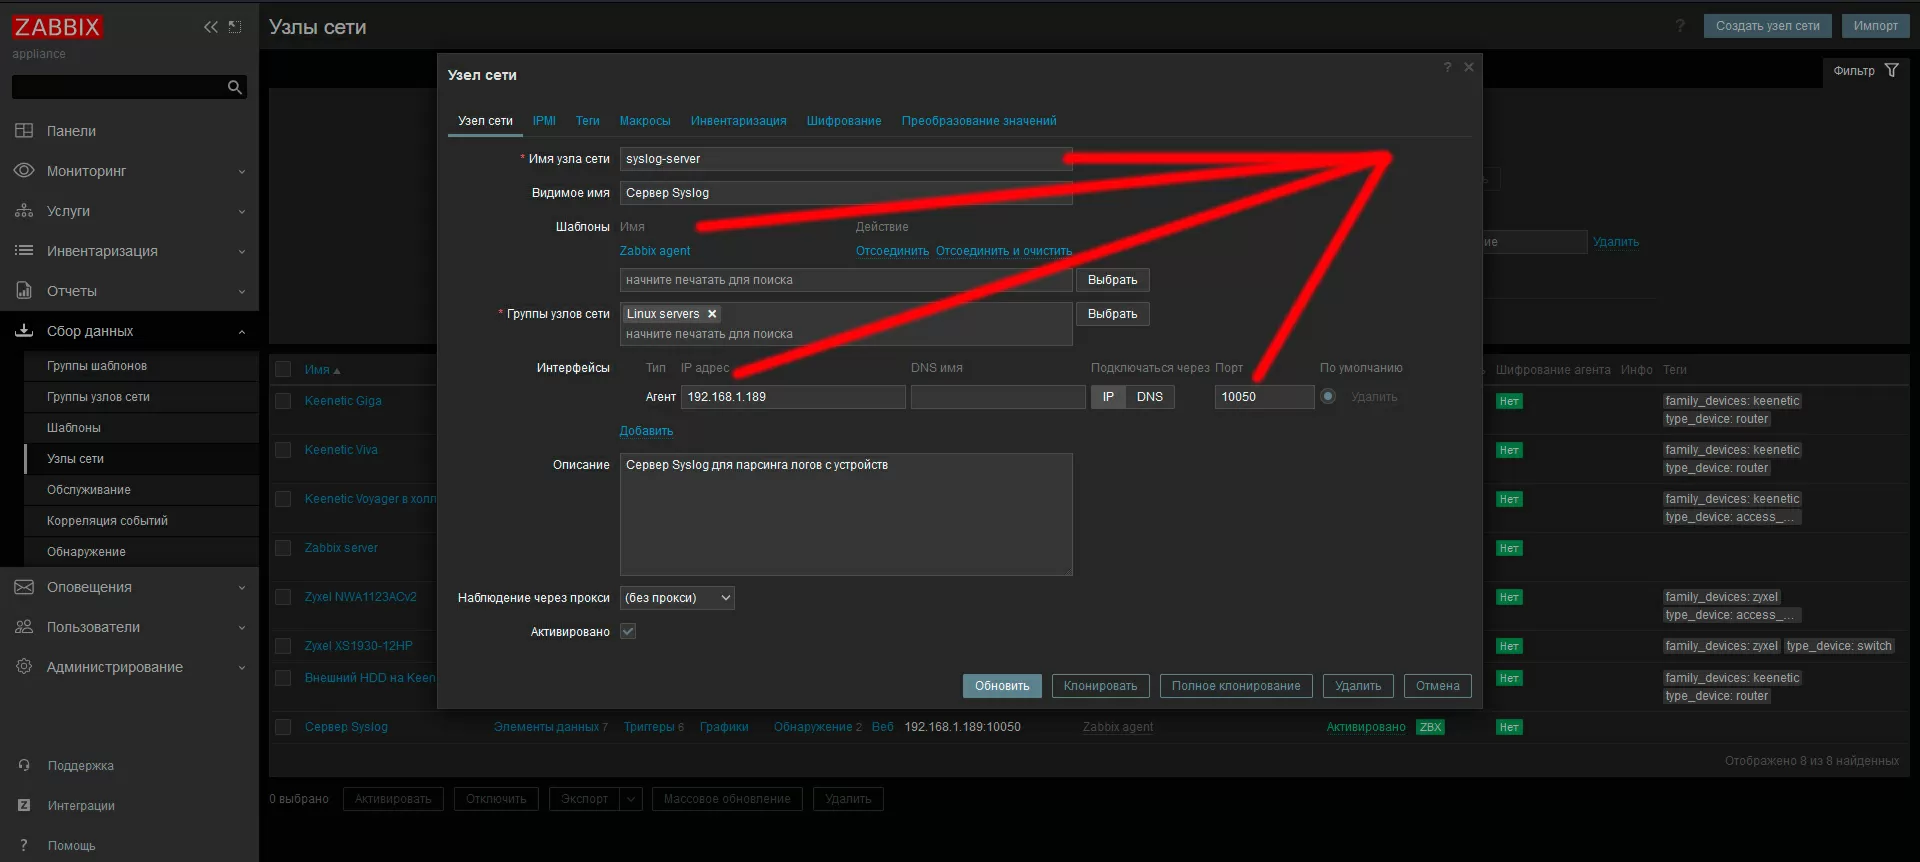
In Zabbix, we need to add a new Syslog server node, be sure to specify the same hostname that is registered in the server settings (in our example, Hostname=syslog–server). The node group is better to choose Linux servers, and the template is Zabbix agent (active).
Now we have to choose which events of the "Kinetic" logs to load into Zabbix, so as not to clog the ether with ordinary service messages such as connecting and disconnecting clients. Usually, for these purposes, a log scraper (node " Syslog server") selects only certain entries from the log stream using regular expressions. Most of the recommendations contain examples for parsing only strings containing the WARNING, ERROR, CRITICAL and FATAL flags, and life would be bland and tasteless if the kinetics marked their messages in the logs according to the degree of importance, but this is not the case, so you have to configure everything yourself.
The algorithm of actions is simple: we simulate a failure on Keenetic, look at the message in the log through its Web interface and create a data element on its base using a regular expression. For example, when a client enters the Wi-Fi password incorrectly, the following message is written to the log file:
Network::Interface::Mtk::WifiMonitor: "WifiMaster0/AccessPoint1": STA(50:76:af:dd:e2:ad) MIC differs in key handshaking (msg 2 of 4-way)
from which we only need
MIC differs in key handshaking
Go to the data elements page in the syslog server (!!!not on kinetics!!!) and now create an element specifying Zabbix agent (active). At this moment, the ZBX icon should light green, if not, check the connection with the Zabbix agent, traditionally starting with the Firewall, correctly specifying the Hostname and the agent config.
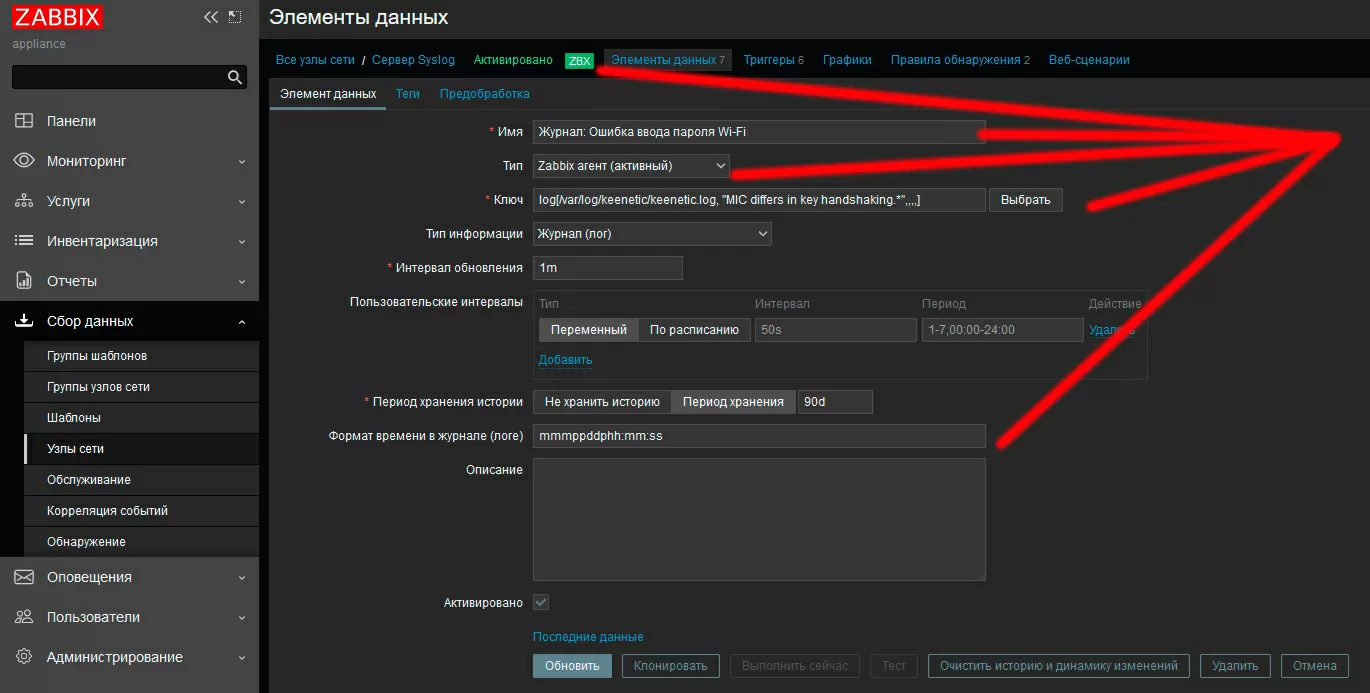
Go to the data elements page in the syslog server (!!!not on kinetics!!!) and now create an element specifying Zabbix agent (active). At this moment, the ZBX icon should light green, if not, check the connection with the Zabbix agent, traditionally starting with the Firewall, correctly specifying the Hostname and the agent config.
log[/var/log/keenetic/keenetic.log, "MIC differs in key handshaking.*",,,,]
We put a trigger with a specified trigger frequency on the resulting data element. For example, I set up three events: incorrect input of the Wi-Fi password, changing the configuration of the access point and rebooting after automatic updates. For kinetics working in router mode, you can configure various events related to VPN or the operation of other services. The trigger for logs is created in the same way as for metrics, with the only difference that you do not need to write a regular expression - when you click the "add" button, you will already have a list of ready-made keys from the events you added [sounds scary, but in fact - three mouse clicks].
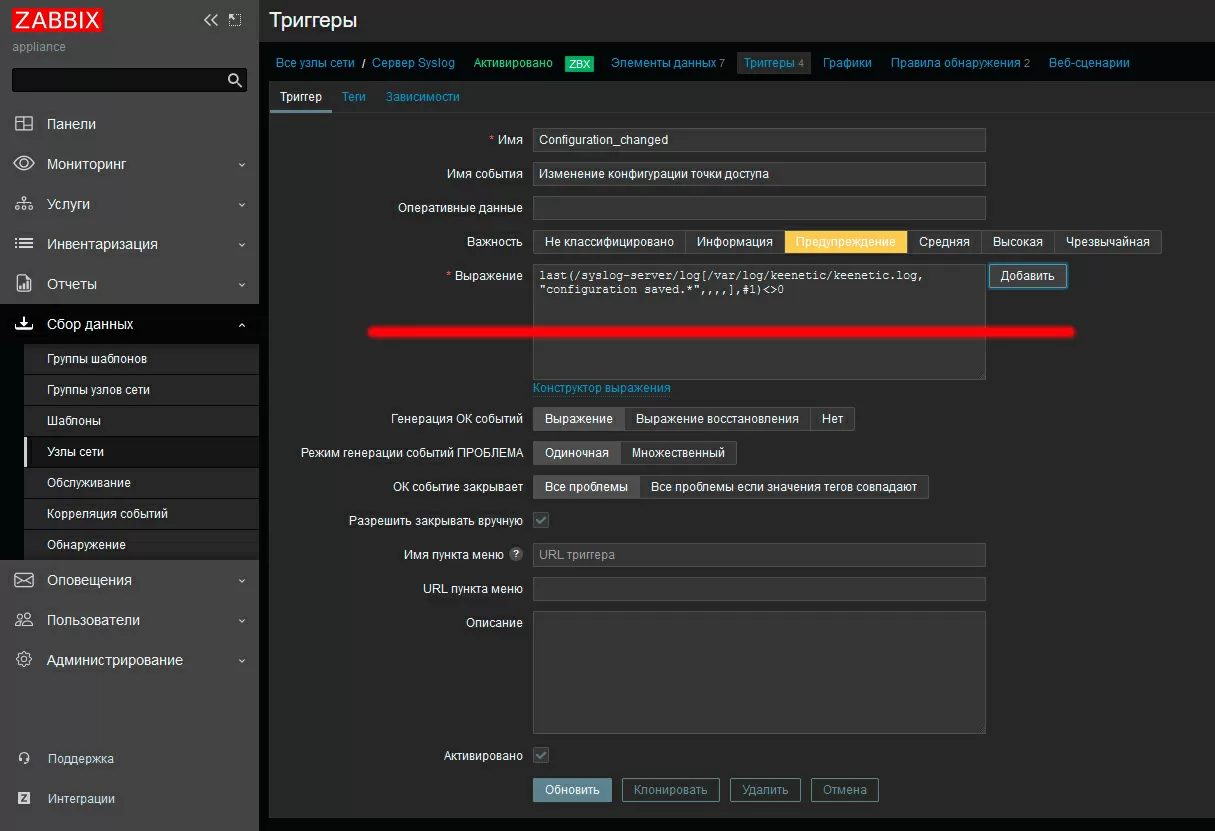
Keenetic has an unpleasant feature – instead of repeating the same event, it simply writes "last message repeated n times", and this is bad, because this approach greatly complicates the setting of triggers by the frequency of triggering. I hope that the manufacturer will fix this in future firmware versions when/if he gets around to clean up the logs.
Bringing beauty
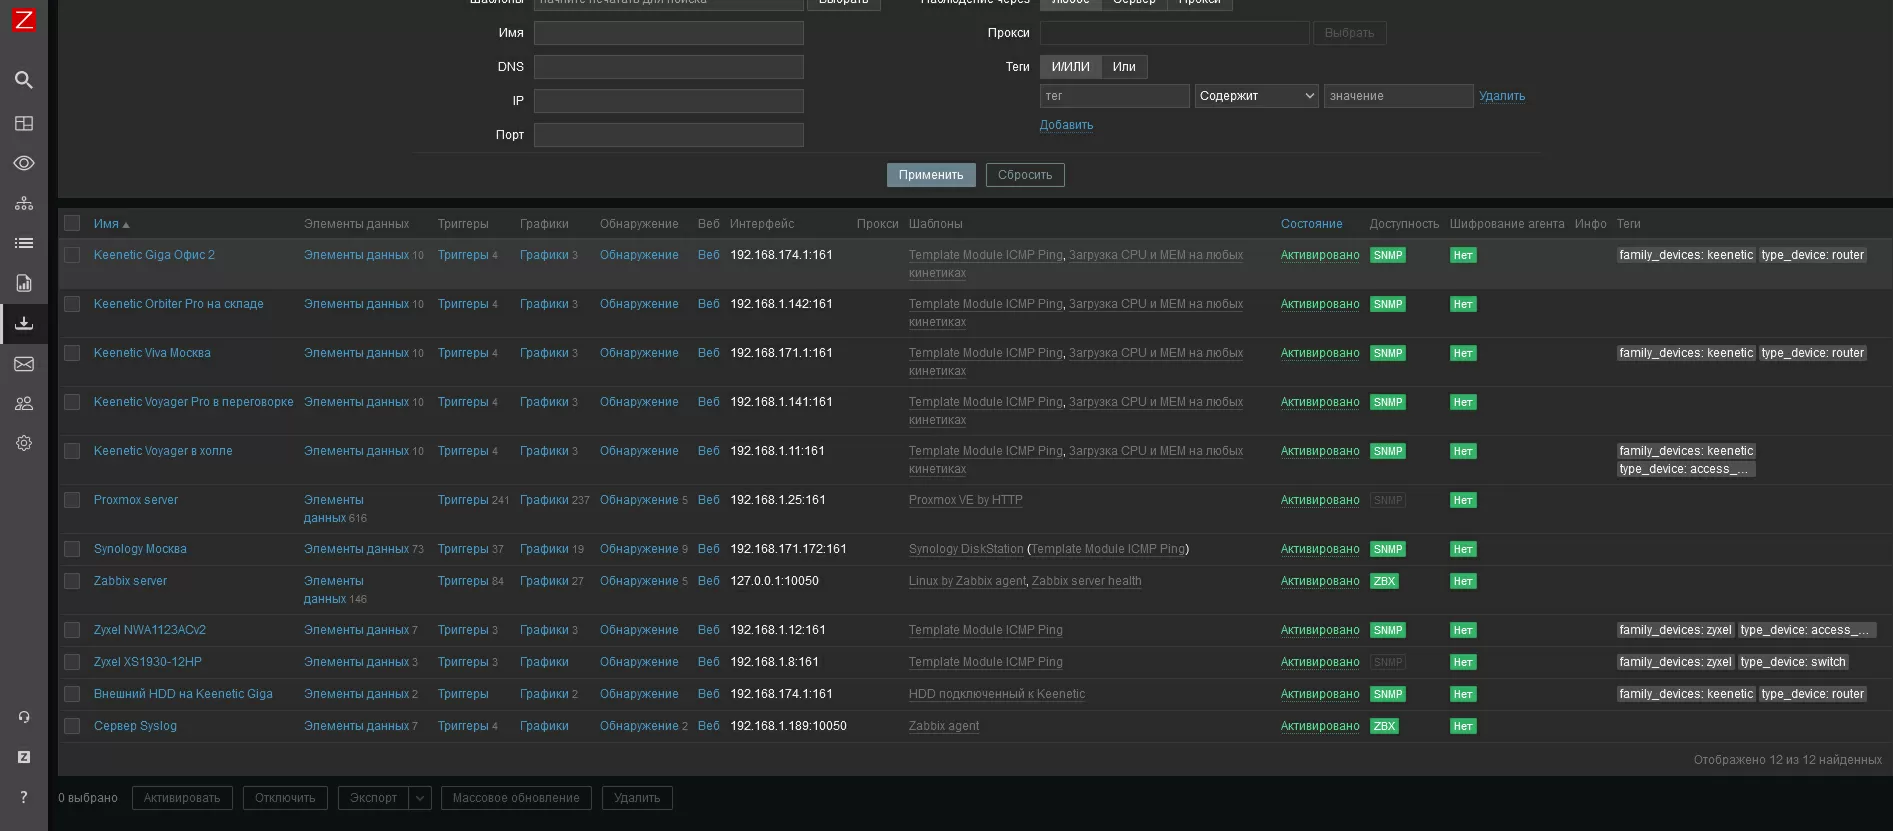
If you have read up to this point, you already have a rough idea of how to add graphs based on the collected metrics: select our Keenetic Voyager, click on the "graphs" and simply set the data on which they are built.
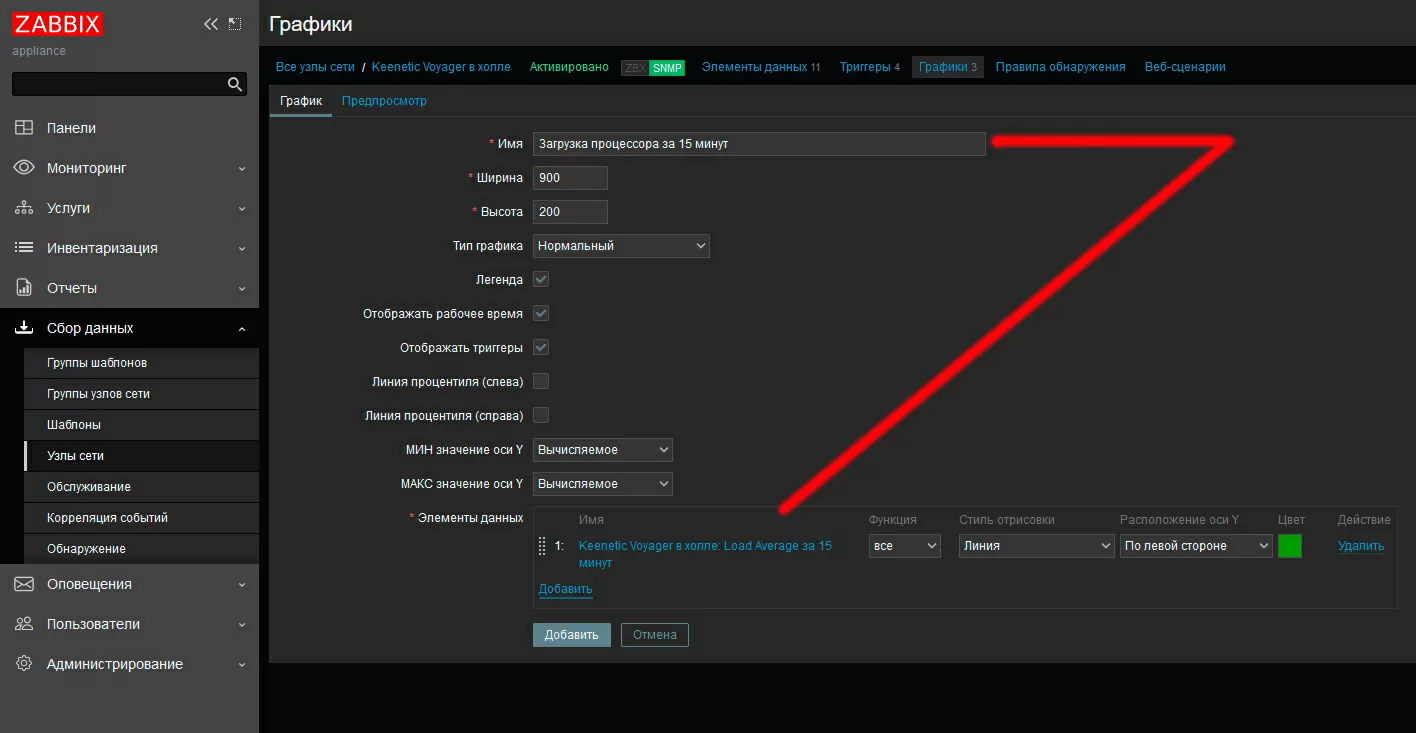
Don't get carried away with a lot of graphs - Zabbix builds them according to a schedule, graphically and eats up resources at the same time.
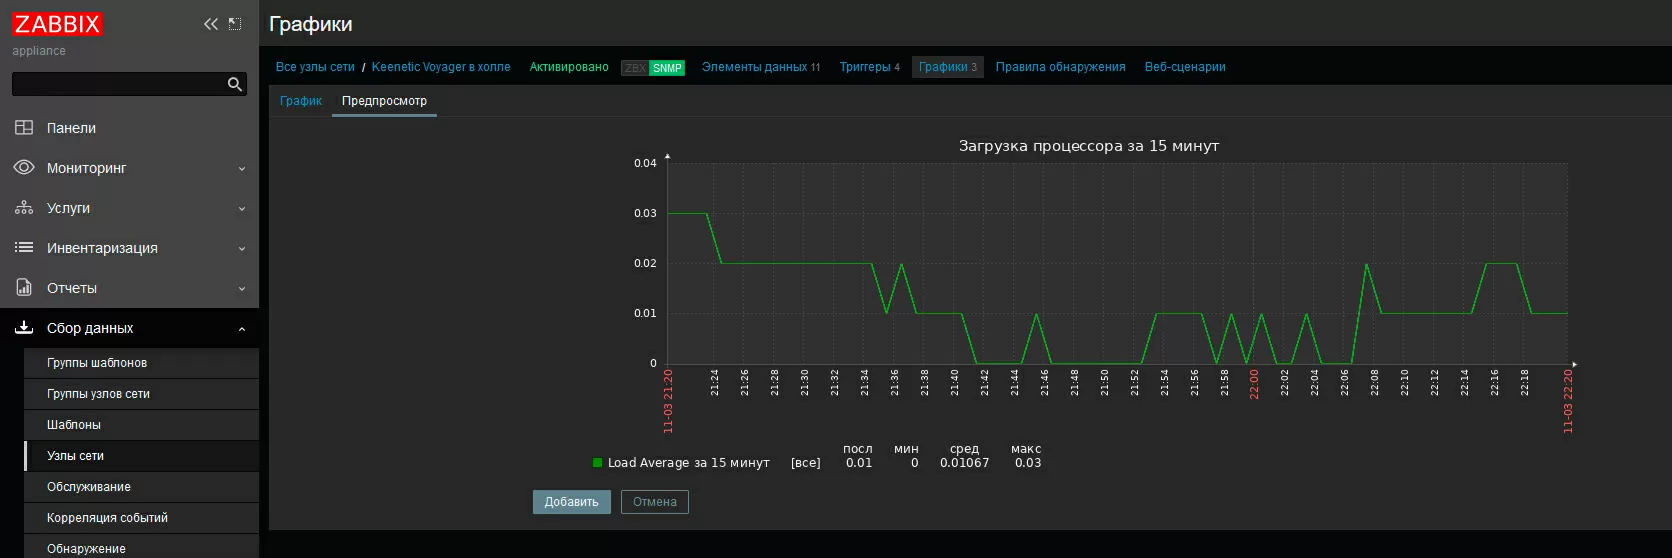
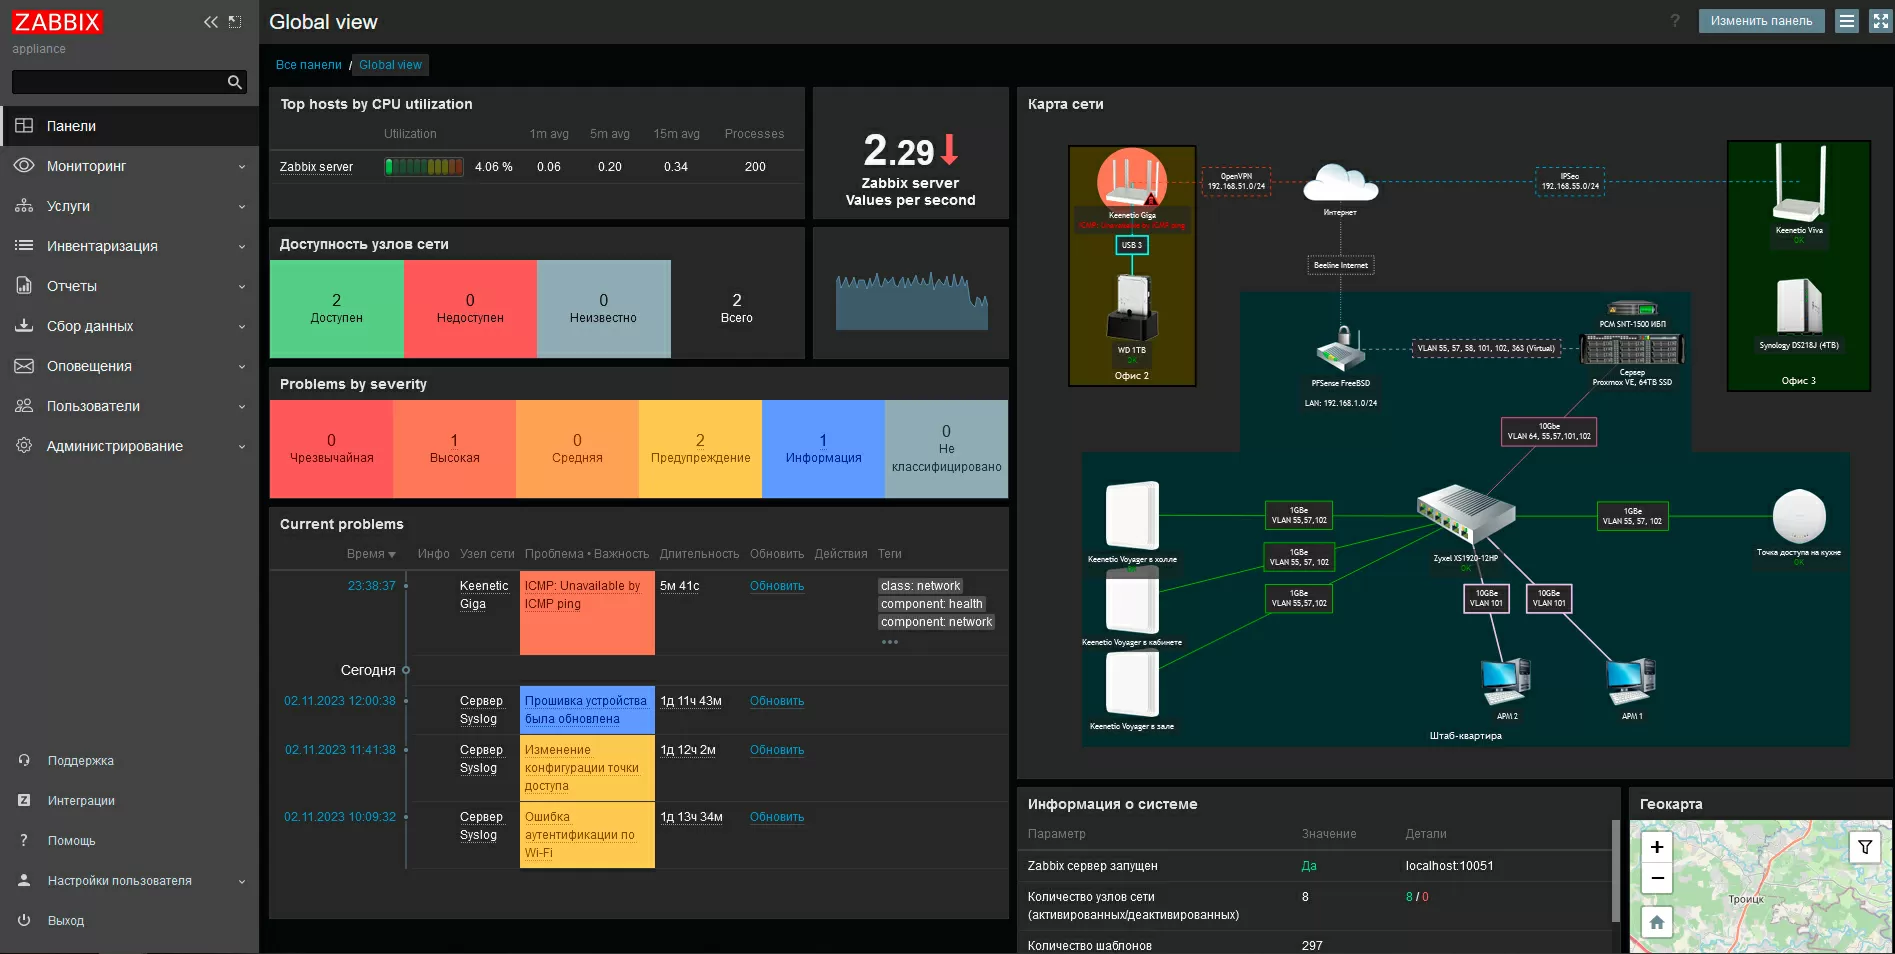
The visual part is clearly not the strongest side of Zabbix: everything related to graphs and network diagrams here looks just disgusting, static, mediocre and banal, but this does not mean that we do not need to try to fix the situation somehow.
![]()
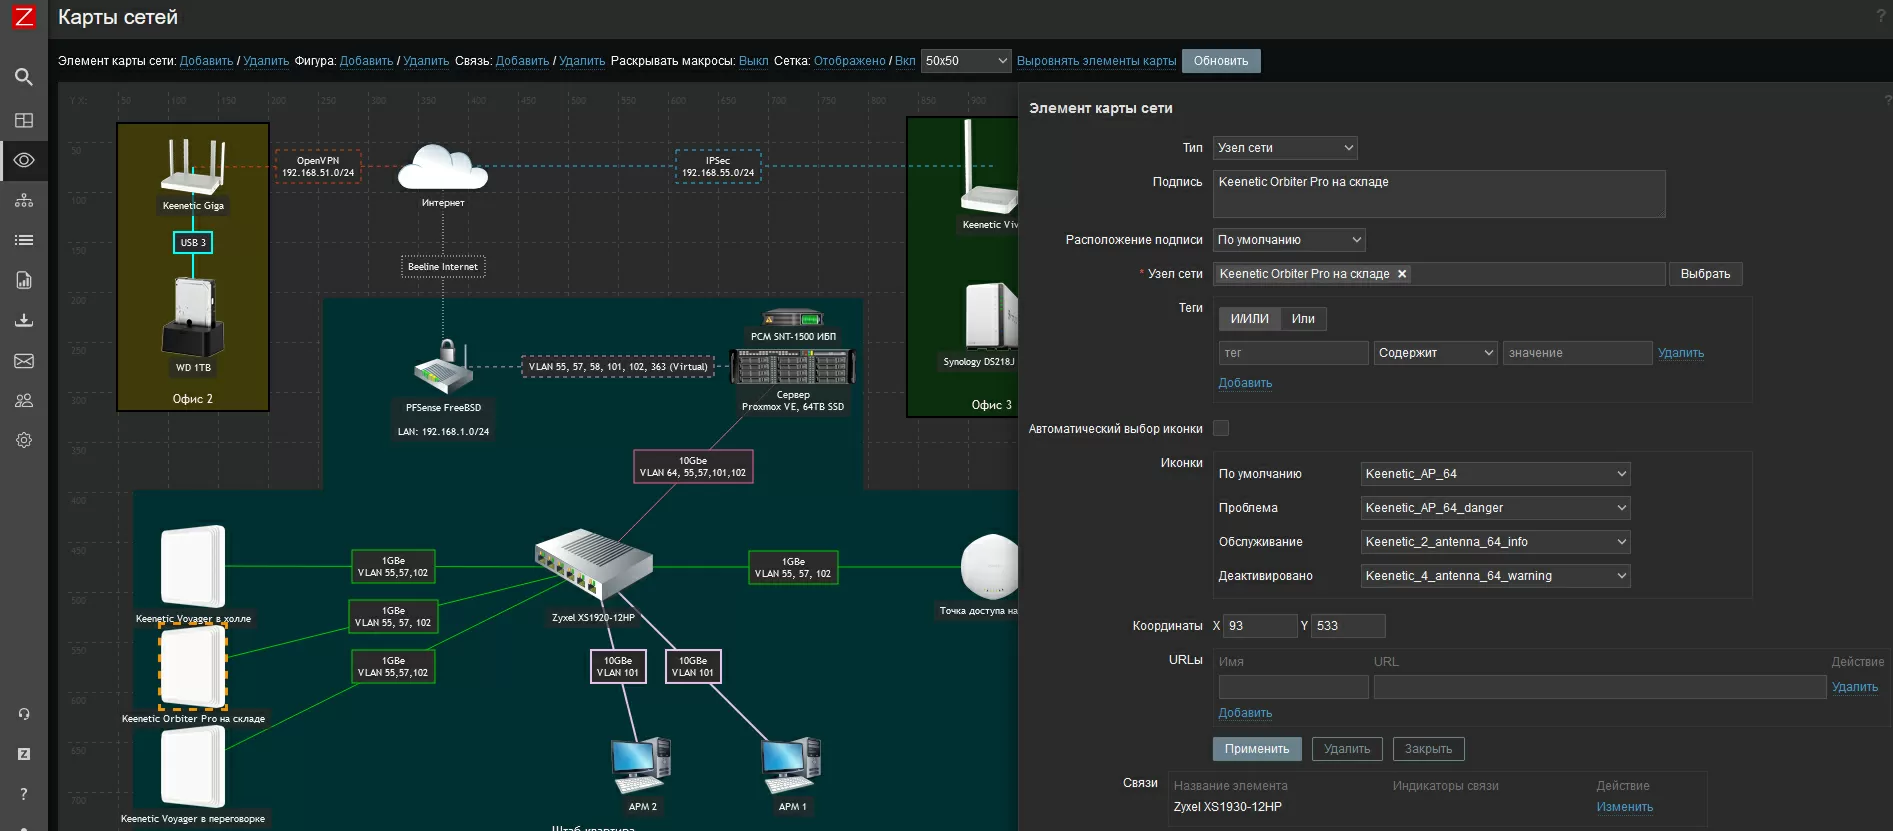
First of all, we add our kinetics to the existing network map and/or create a new one for them. Zabbix allows you not only to upload custom device icons to the database, but also to use different images for different device status, so that it is easier to navigate on the map on which device the problem is or which is temporarily disabled. I have created a basic set of icons for all types of Keenetic available today, including a socket repeater and a VoIP gateway, an overview of which is on our website. Download a set of Keenetic icons for Zabbix in high quality without registration and SMS you can by link.
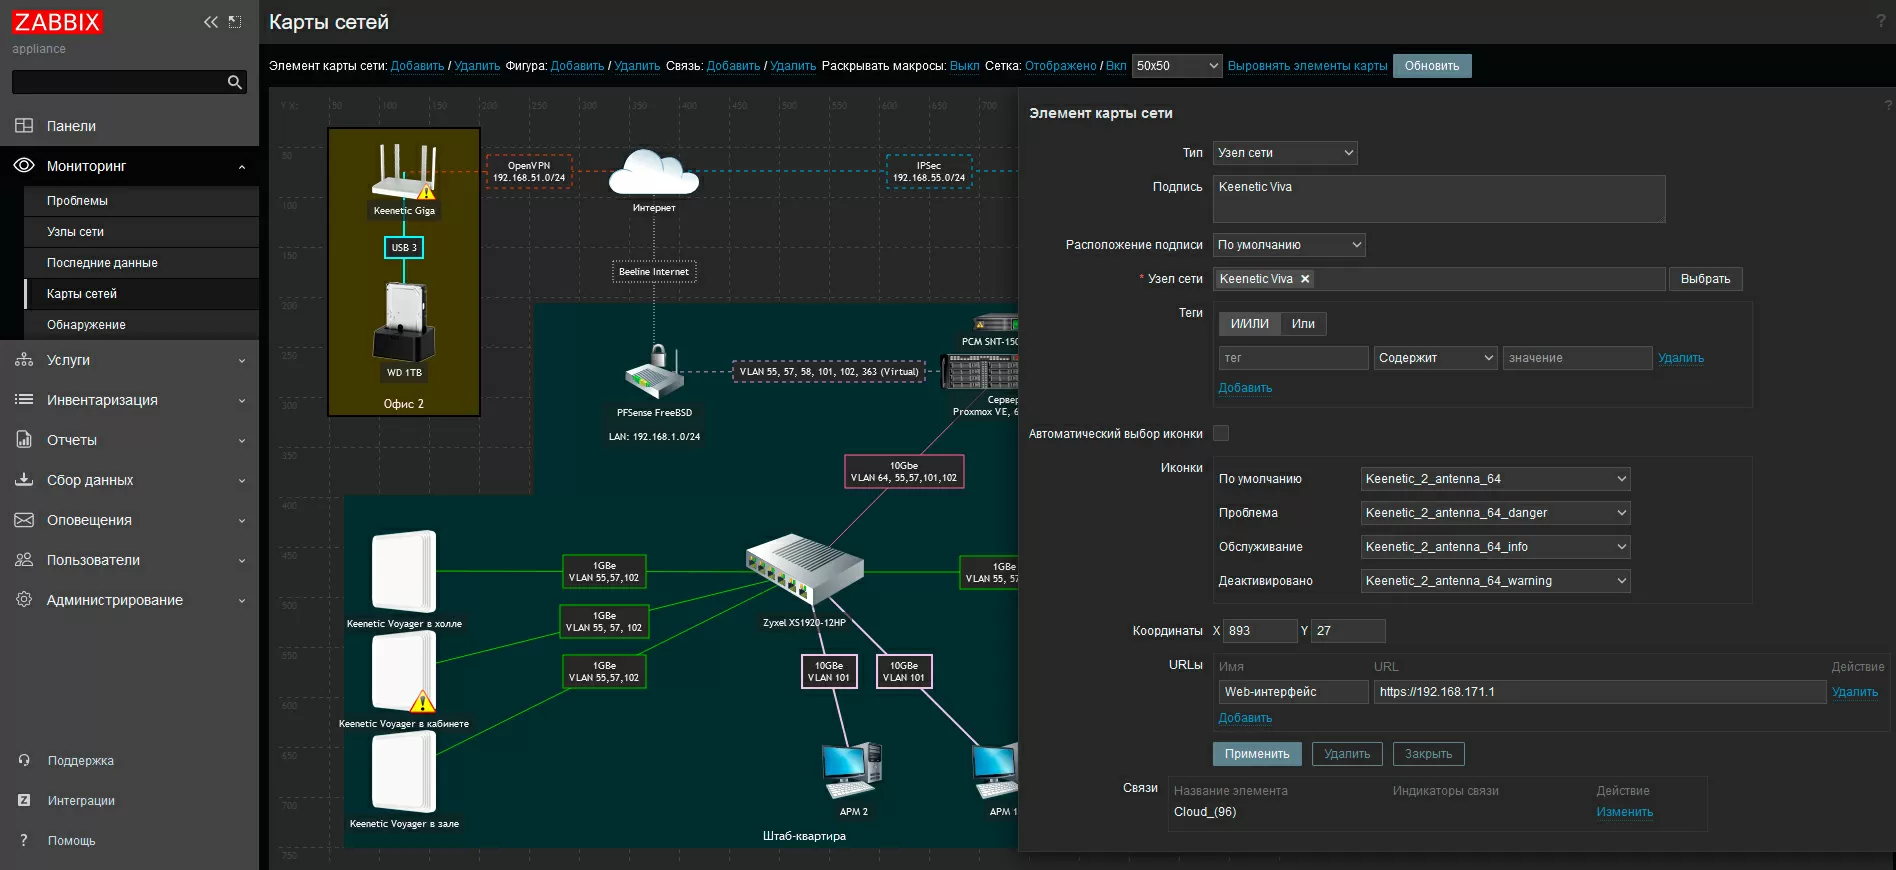
On the map above, I have a network on Keenetic with activated monitoring via VPN and in the locale. Please note - in one window I immediately see the status of the Zyxel network switch, pfSense software gateway, server, UPS, and there is also a Synology NAS and a couple of workstations. For a hard disk connected to Keenetic Giga, I created a separate network node and applied the appropriate metrics to it.
Creating a template and applying it to new access points
As you remember, all this time we configured only one Keenetic Voyager Pro, located in our lobby. It's time to add a few more similar access points to Zabbix, and in order not to configure them from scratch, we create a template from monitoring settings, which we will then apply to new arrivals. Select our access point in the "Data Collection" tab - "Network nodes" - "Keenetic Voyager" - "Data Elements", tick all its native metrics (except those that were applied by third-party templates) and click down the "Copy" button.
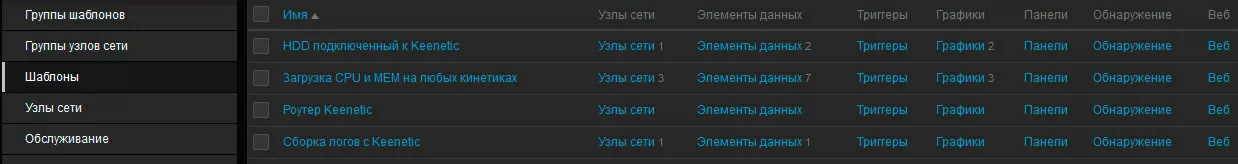
Here I want to note that you may have different Keenetics on your network: repeaters, access points, routers, so it's better to create several instead of one common template, otherwise broken triggers will torment you. Such functions as NAS, or the speed of packet translation, are carried out in separate templates, memory and CPU loading - in your template, log assembly - in your own. We do the same with triggers and graphs, after which only templates should remain on the first device that we configured.
Please note that basic checks such as pinging are built into Zabbix and are applied by separate templates. We additionally apply them along with our templates.
Everything, now when installing new access points, it will be easier for us: in the web interface of each device, enable SNMP, enable export to Syslog, add them to Zabbix and apply the previously configured template, it takes 15 minutes for each device. Well, for those who have read up to this point, I suggest downloading my templates for Keenetic that I used in this article. You can import them into Zabbix and make the setup process easier.
You can easily set up event notification methods yourself: Zabbix can both send E-Mail and write to Discord and Jira, is friends with Telegram and SMS services - there is nothing complicated there.
Finally
Even large network manufacturers do not always provide publicly available data for third-party monitoring systems. Quite often, simple MIB files lie behind three walls of registration of a client / partner / integrator on a corporate portal, and it is not so easy to get them or they are not available at all as a class. With SNMP support, too, not everything is smooth for everyone, and although this protocol is as old as mammoth bones, it quite happens that a network switch for $ 1-2 K can issue a timeout for an SNMP request, returning only half of a short "tree". Setting up monitoring systems, dashboards, and log parsing is a long painstaking work that is very often abandoned halfway through or not taken up at all, forever postponing "for later", but it must be done.
Keenetic could make life much easier for system administrators if it added authorization and more metrics to SNMP, combed log files in accordance with "best practices", wrote and posted templates for modern monitoring platforms on Github and added an exporter to Prometheus/Graylog. But even with what we have now, you can easily integrate kinetics into your corporate monitoring system.
Michael Degtjarev (aka LIKE OFF)
09/11.2023