Mellanox data center telemetry technologies for detecting network and storage problems
Let's talk about network streaming telemetry and why you need it. If you've ever had problems trying to recreate a network problem, or you've had a hard time understanding why you were experiencing packet loss, or if you're a network administrator facing server or storage performance issues, you need good network telemetry. Because the network allows you to access applications, exchange data, and connect to storage, good network streaming telemetry is also good application telemetry. Company Mellanox has decided that its ASICS are good enough to tell you the whole truth about where, when, and why packets are dropped on the network.
Some of you may ask, what is telemetry?
Similar to a car, telemetry is a speedometer, tachometer, oil pressure sensor, engine temperature sensor, and dashboard warning lights-the data you need to get where you want to go safely and find out how the car is doing along the way. Whether you're driving a car or flying a plane, you need good telemetry, and the faster you travel, the more important it is. Similarly, if you maintain a data center, deploy VMS and containers, or manage storage deployment, you need visibility of what is happening inside the network structure. And the faster your network is running or the more critical network performance is for your business, the more important it becomes. Switching streaming telemetry can give you this important visibility.
Switching from protocols to streaming telemetry
The Old network management technique was that more means better: more protocols, more captured packets, and -in case of a problem-digging deeper into the captured packets to find the cause and then fix it. But over the past few years, there has been a trend towards simplification in data center networks. The more advanced the data center, the fewer protocols they like to run. Back in my tech support days, we had a saying “ " the smarter the customer, the shorter the configuration file."this adage was based on the fact that the greatest problems occurred for those who immediately turned on all the functions and support for all the protocols.
The Main exception to the simplification trend is the need for greater visibility, since smart people want to see what is happening inside their network. As networks get bigger and faster, experienced administrators use fewer protocols, but strive for more network telemetry to achieve better visibility.
Some network administrators want to improve streaming telemetry to reduce the time it takes to find the root cause of problems, to exclude anything that doesn't cause the problem. Most network administrators don't really know if their networks are being used insufficiently or excessively, because they have poor visibility of what is happening inside the networks themselves. Without this understanding, it is impossible to effectively manage the network or develop it correctly.
Mellanox WJH (What Just Happens) - what the hell happened to this network?
WJH is a switch-level monitoring solution where the switch's ASIC monitors line speed flows and alerts you if you have performance problems due to packet loss, congestion events, routing loops, etc.

When a regular network switch drops a packet, it is sent to bit-heaven, never to be seen again. The packet and all useful diagnostic information will simply disappear, and most of these switches will increase the internal counter of such losses. When you check this counter, the switch will say, " Oh, you have 504 packet drops due to a crooked VLAN." But the switches won't tell you anything about the packet that was dropped, when it was dropped, or why it was dropped.
In turn, Mellanox WJH will allow you to see these lost packets and tell you why they were dropped. WJH will let you know if you have overload or buffer issues or even security issues. For example, if you use a large number of ACL rules and packets are dropped, you may have an infected server or VM. Or you may have a poorly configured ACL that needs to be fixed.
In lossless environments such as NVMe over Fabrics (NVMe-oF) running on RoCE, performance issues may occur even if packets are not lost. They can be caused by congestion, a pause between frames, or a large delay. Very often, it turns out that the main reason is uneven load balancing through the LAG or ECMP group.

Mellanox WJH-hardware-accelerated telemetry, in which the ASIC switch saves important parts of dropped packets. The switch will not store the entire packet or all regular packets, as this will require a lot of space. Instead, the switch stores important parts of the problematic packet, such as the source and destination IP address, MAC, port numbers, and so on, as well as some very detailed descriptions of why, when, and where the packet was dropped.
Hardware acceleration allows the switch to record all important packets with detailed information, even when the switch serves several 100-Gigabit ports.
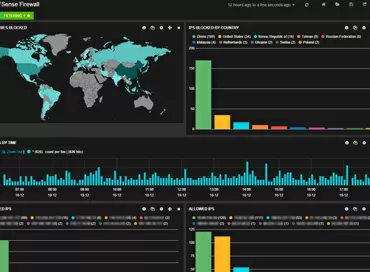
In large projects, a switch with WJH technology can transmit these packets to a centralized database using gRPC. Then you can use ready-made Open-Source solutions, such as Kabana and Grafana. The switch can also generate a p. cap file of all dropped packets, so you can look at it using Wireshark. WJH helps you get to the bottom of problems by showing who is being affected, which applications, which servers, what is causing the problem, when and where the problem occurred on your network.
New hope in network telemetry
WJH is a new way to monitor the network. Traditional network monitoring tools collect tons of unnecessary data and parameters. They can even use sFlow to sample random packets, counting on you to collect all this information so that you can use it to extrapolate or guess what went wrong on your network.

For some reason, the most complex network problems usually occur at night or on weekends, and then you need to spend several hours structuring a whole mountain of data from telemetry to find the root cause of the crash. There are even predictive Analytics tools that say, " Hey, we'll look at this mountain of data for you, and we'll give you 60-70% confidence that they've found the root cause. They'll make that guess for you, but in the end, it's still just guesswork. The problem is that you have too much data (from a sample of packages), but most often it's not the data you need (what, where, when, and why).

The Old approach tries to guess when the problem will happen again, and set up a re-creation script on the test bench or packet trace only so that the problem doesn't show up, so you try again next week... and a week after.... This was the impetus for what just happened, Mellanox's advanced telemetry technology. With WJH, we work with those packets that are dropped and we report them, we can help you get to the root cause and give you the whole picture of the network without having to replay the problem.
So, how do I deploy WJH?
Now I know some of you are thinking “" this sounds awesome, but I can't replace my entire network with Mellanox switches.” The great thing about WJH is that it works independently of the rest of the network. A Wjh running on one switch can report errors that are likely to occur on other switches at this network level that perform a similar function. This is very different from In-Band telemetry, which works best with all switches from the same vendor.
Step 1 - Most people start using WJH by performing a network scan, which is performed by enabling WJH on the switch they have connected to their network. People are almost always surprised when they encounter errors that they haven't noticed before. So, step one-just turn on WJH and see what's really happening on your network.
Step 2 Is the next cleanup step, where network, server, and storage administrators deal with errors detected by WJH technology in order to avoid problems on your network.
Step 3 - WJH is configured for limited data collection, you personalize WJH for your network and your management needs:
- You can set some filters, because you don't need to report certain types of "normal" errors.
- You can set the WJH agent to aggregation mode, which stores only one copy of the problem package instead of 1000 identical problem packages.
- You can set the severity level of issues that are important to you. Some of them may be critical and require immediate notification, while others you can check later or even ignore.
- you can set actions for severity levels, for example, you may need to send an email message for significant issues and no warnings for minor issues.
Mellanox WJH is a great tool for advanced network managers, as well as for network novices who just want an easy way to identify network issues due to server and storage issues. With WJH, you don't need to be a network expert to find the root causes of performance problems very quickly.
Advanced streaming telemetry technology is good for your business - it will help you get more productivity, uptime, and performance from the networks you operate.
Ron Amadeo
27/06.2019